Analytics (KPI workspace)
Optional after core setup steps 1–15 — month-range KPI charts when your role includes Analytics module permission (analytics.module). Reconcile figures with Dashboard snapshot cards and Finance ledgers during Portfolio KPI review. Complete Getting Started — Recommended Setup Sequence first.
Confirm Who can use it, then skim Layout and controls and Tab overview before Revenue, ADR, and RevPAR tabs (shared layout). Operational follow-up: Maintenance tab. Reconcile figures with Dashboard and Finance during Portfolio KPI review. Guide subsection map: Analytics guide subsection index (tab sections + Related subsections). Habit-specific shortcuts live under Related below.
The Analytics module (/analytics) is the portfolio KPI workspace: charts and breakdowns for Overview, Revenue, Occupancy, ADR, RevPAR, and Maintenance over a configurable from–to date range you pick in the toolbar. It answers “how is the portfolio performing over time?” — not “what should this listing’s nightly rate be next week?” For per-listing availability, pricing grids, and channel status, use Sales instead.
Reconcile month-end charts with Finance Income and Sales Pricing grids; pair Dashboard snapshot cards for daily ops. When Revenue or debt KPIs spike during Portfolio KPI review, triage payment overdue alerts with Handling a Late Payment — Step 1. Poll AI usage API during Portfolio KPI review — Step 7 when assistant or utility-bill extraction volume should explain operational spikes. When weak metrics look tied to one tenant category, scope Finance — Tenant category filter (or Bookings — Tenant categories) during Portfolio KPI review — Step 6 — see Glossary — Tenant category.
Open Analytics at platform.vivin.app/analytics. Bookmarkable tab routes are listed in Deep Links — Analytics (KPI Dashboard).
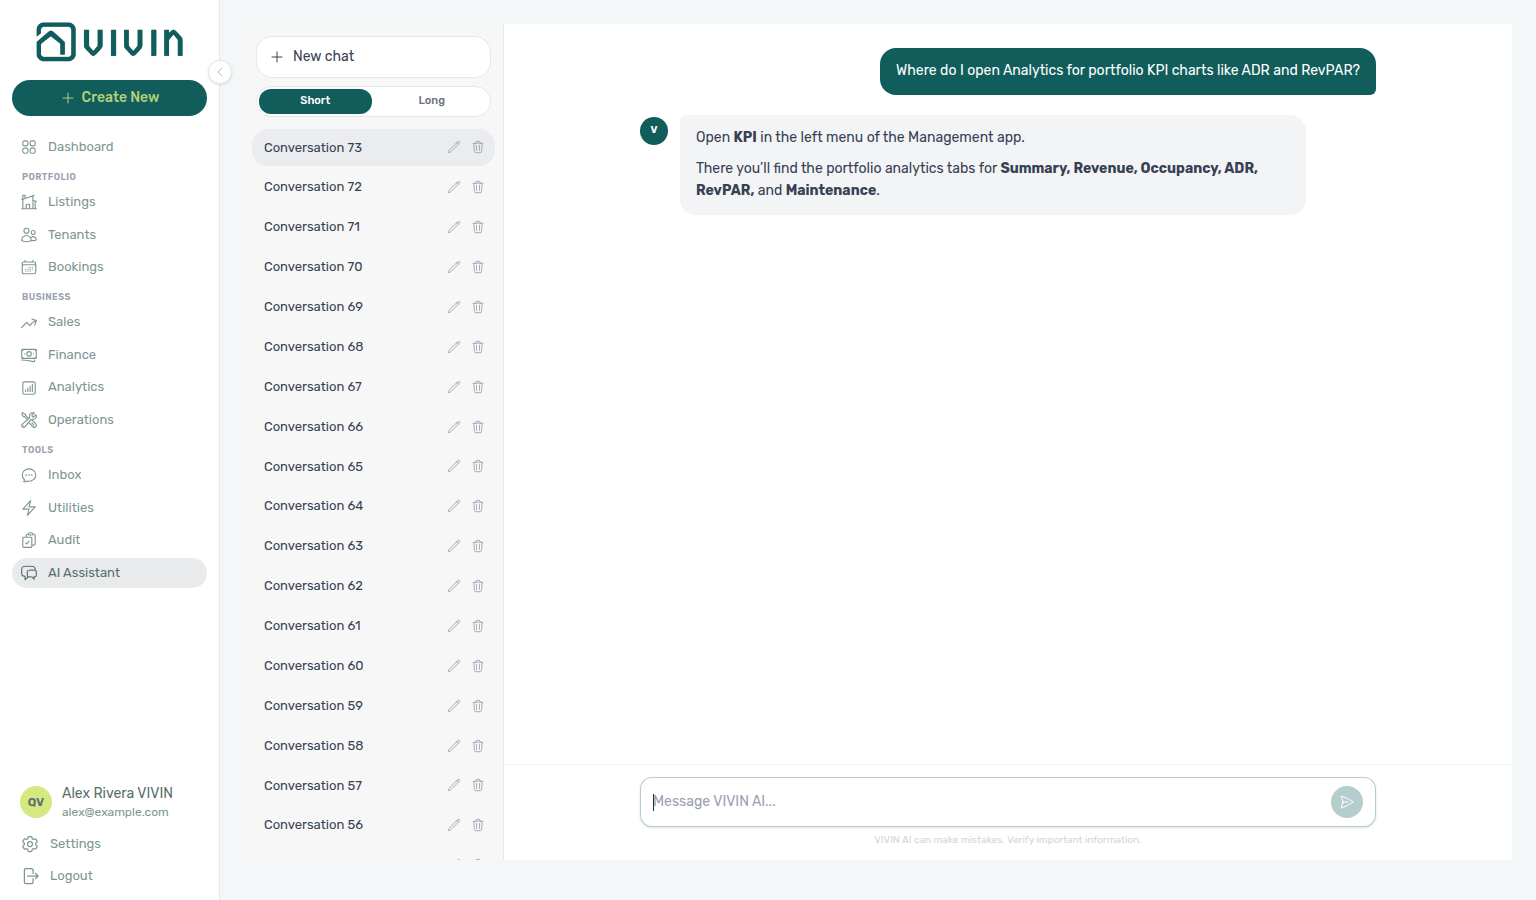
Not sure which Business item holds portfolio KPI charts? Ask AI Chat “Where do I open Analytics for portfolio KPI charts like ADR and RevPAR?” — then open Business → Analytics (ai-chat-product-context-analytics-reply.png, ai-chat-product-context-analytics-flow.mp4). The assistant may say KPI; the sidebar label is Analytics. Use Overview / Revenue / Occupancy / ADR / RevPAR / Maintenance for trends; cash collected and debt stay on Finance. Habit: Portfolio KPI review.
Need portfolio KPI charts like ADR and RevPAR (not Finance cash/debt ledgers, and not Sales pricing grids)? Ask AI Chat “Where do I open Analytics for portfolio KPI charts like ADR and RevPAR?” — then open Business → Analytics (ai-chat-product-context-analytics-reply.png, ai-chat-product-context-analytics-flow.mp4). The assistant may say KPI; the sidebar label is Analytics. Canonical route: /analytics (default tab Overview).
Who can use it
The sidebar entry Analytics (under Business, after Finance and before Operations) is shown only when your role includes the Analytics module permission (analytics.module). Without it, the link is hidden and opening /analytics (or a deeper tab URL) directly shows the standard permission message. Administrators grant access in Users and roles.
Layout and controls
- Page header — Title and short subtitle for the workspace.
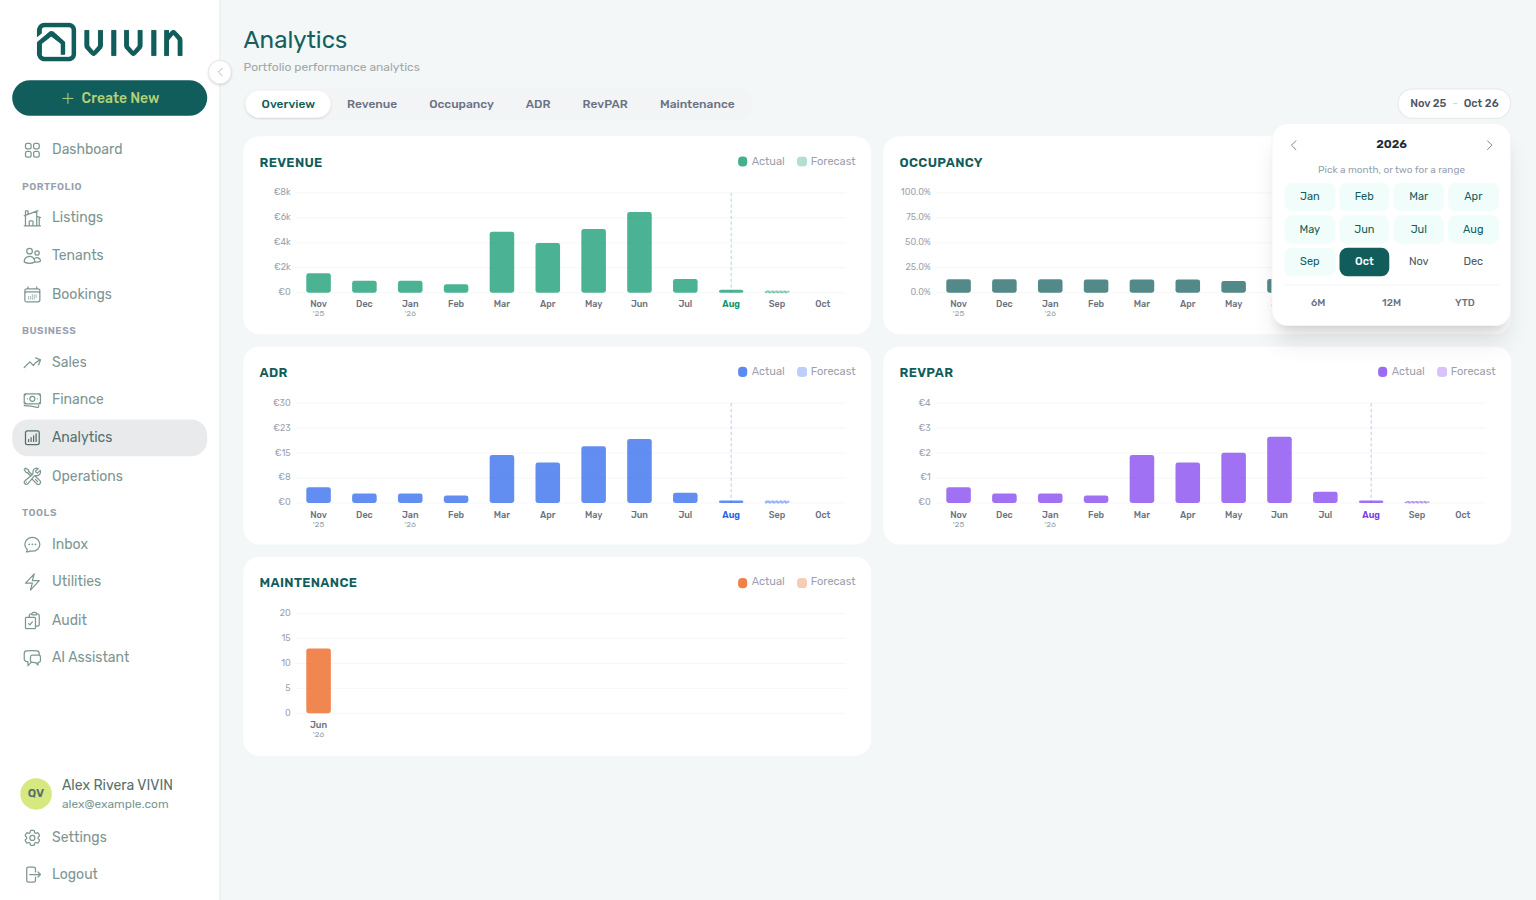
- Tab strip — Pill-style tabs switch the main chart set: Overview, Revenue, Occupancy, ADR, RevPAR, and Maintenance. The URL updates to
/analytics/<tab>(for example/analytics/revenue). - Date range — A from–to month range in the toolbar applies to all tabs; click the range control to open the month picker, choose a start month then an end month, and close the popover. Quick presets inside the picker — 6M, 12M, and YTD — set common windows in one click (rolling multi-month spans anchored on the current month for 6M / 12M, calendar year-to-date for YTD). Every tab reuses the range you pick until you change it.
-
Refresh indicator — A small spinner may appear while portfolio totals refetch after you change the range. On a cold visit or after a large range change, Monthly Trend can take roughly 15–20 seconds to populate; the tab strip and month picker stay usable immediately.
-
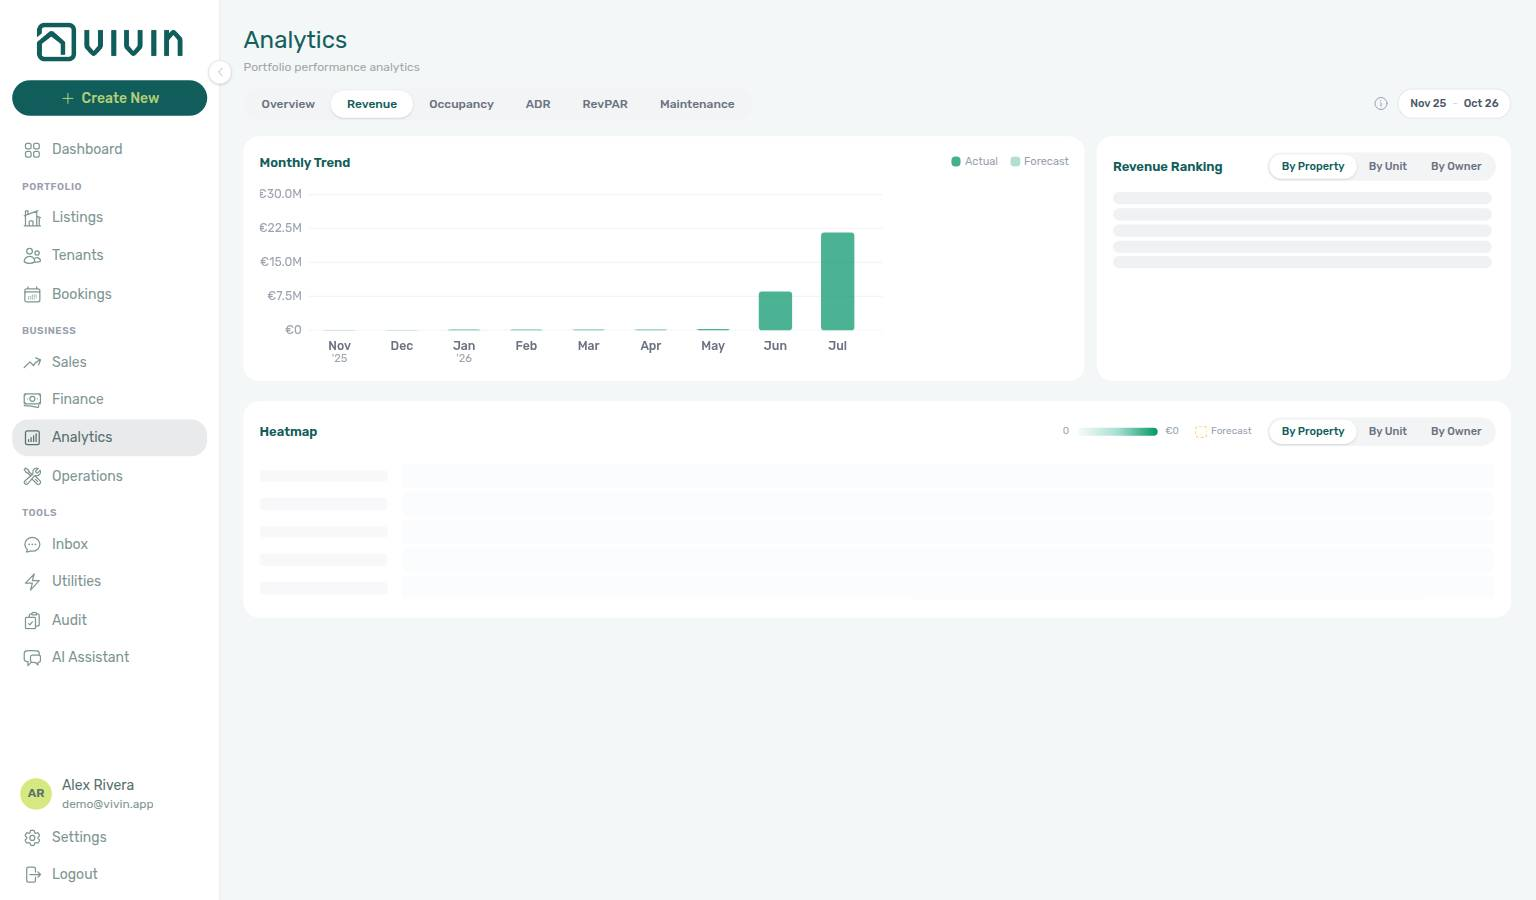
Ranking and Heatmap load separately — On metric tabs, Vivin fetches the portfolio series (Monthly Trend) first, then a ranked breakdown for Ranking and Heatmap. While that second request is in flight, those cards show skeleton placeholder bars even when Monthly Trend already has data — see Ranking and heatmap loading.
-
When charts stay empty — After the refresh spinner finishes, if Monthly Trend is still empty, use Retry before treating revenue or occupancy as zero — you do not need to leave the module or change the month range first. For a same-day snapshot while Analytics catches up, use the Dashboard. See FAQ — Analytics (KPI workspace).
-
Aggregation — Revenue, ADR, RevPAR, and Occupancy expose property, unit, and (when your portfolio has multiple owners and the tab offers it) owner roll-ups on ranking and heatmap sections. Maintenance uses property vs unit only for rankings and heatmaps. Overview has no aggregation control — it always shows portfolio-wide monthly bars.
-
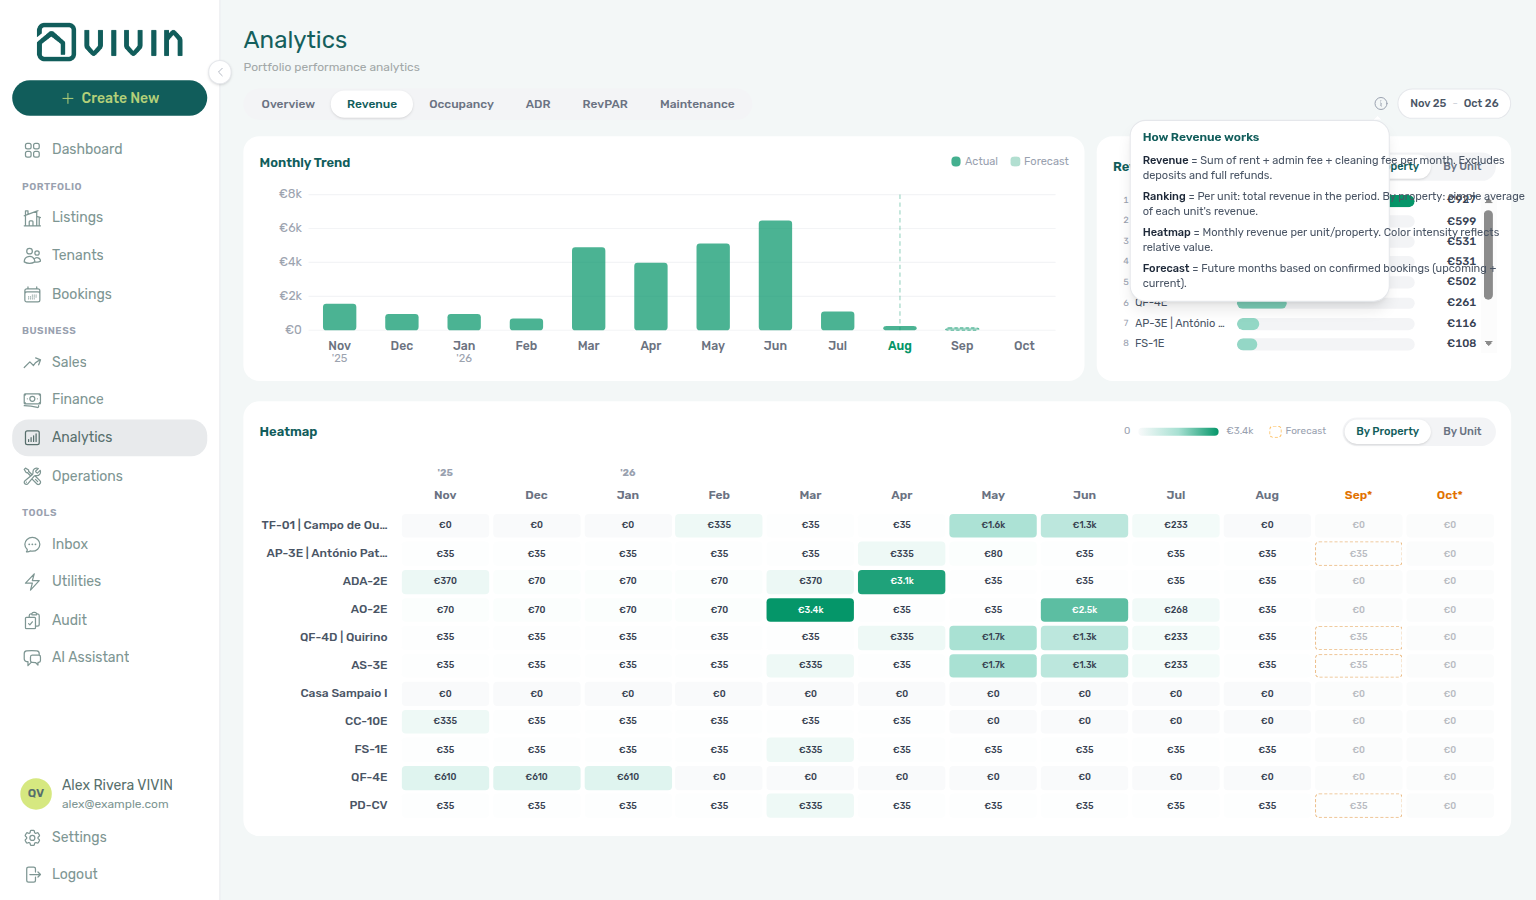
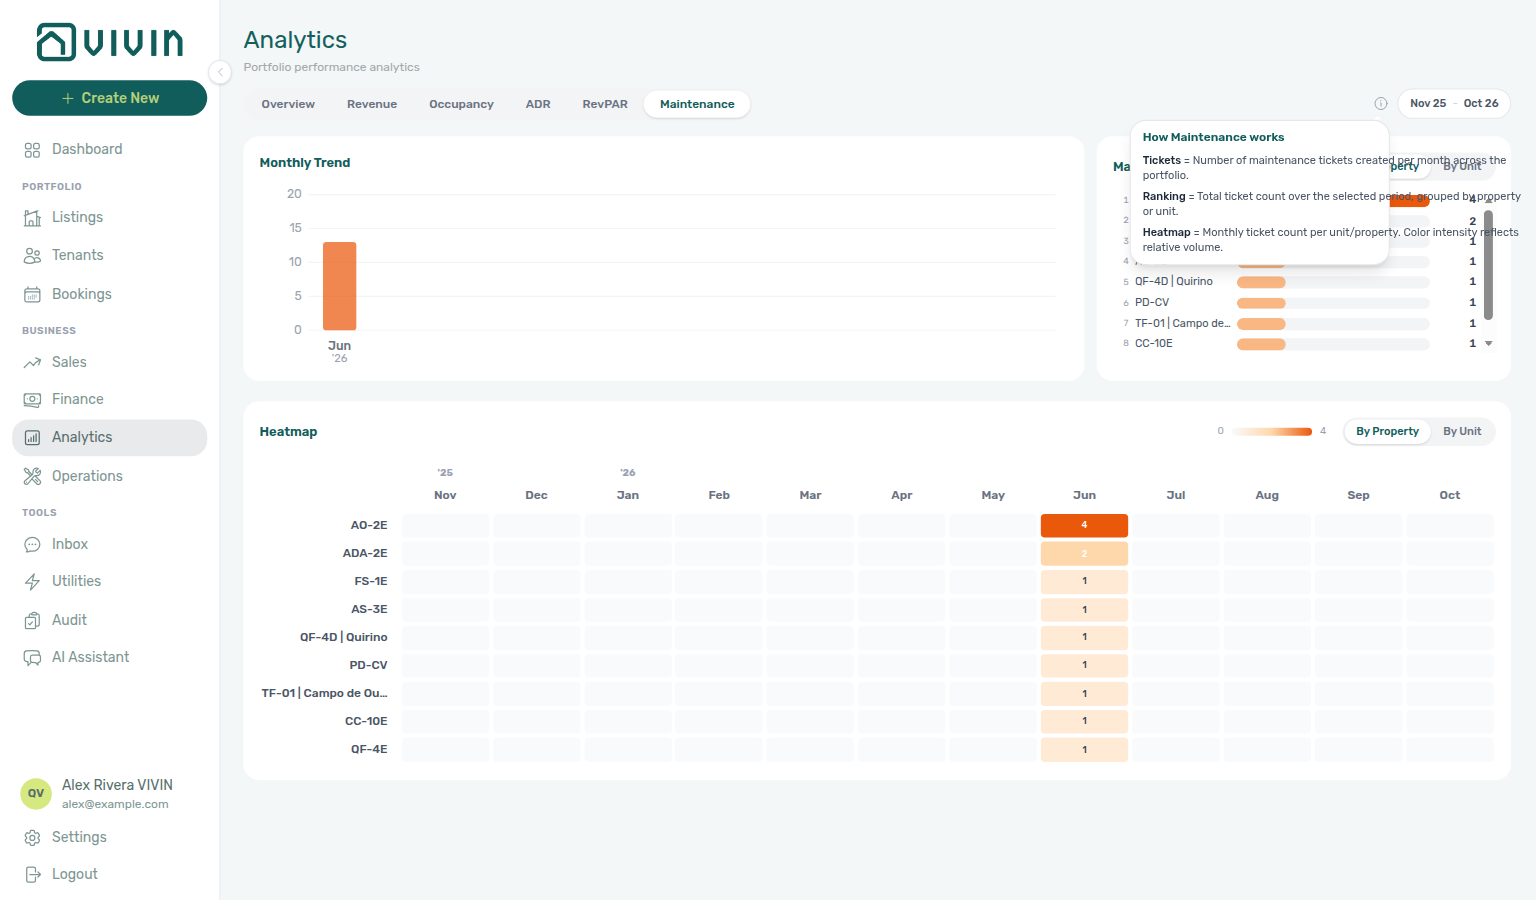
Tab info (non-Overview tabs) — On Revenue, Occupancy, ADR, RevPAR, and Maintenance, an information icon appears next to the month-range picker. Open it for the same definitions the product uses for that tab (revenue components, ranking rules, heatmap meaning, and forecast handling).
Several inner card titles (for example Monthly Trend and Heatmap) are fixed English strings in the UI today; tab names, tooltips, and numeric formatting still follow your interface language where applicable.
Screenshots
These captures use a desktop viewport (about 1536×900): you see the management shell, the Analytics tab strip, and the month-range picker. In the live app, scroll for additional charts or tables below the fold.
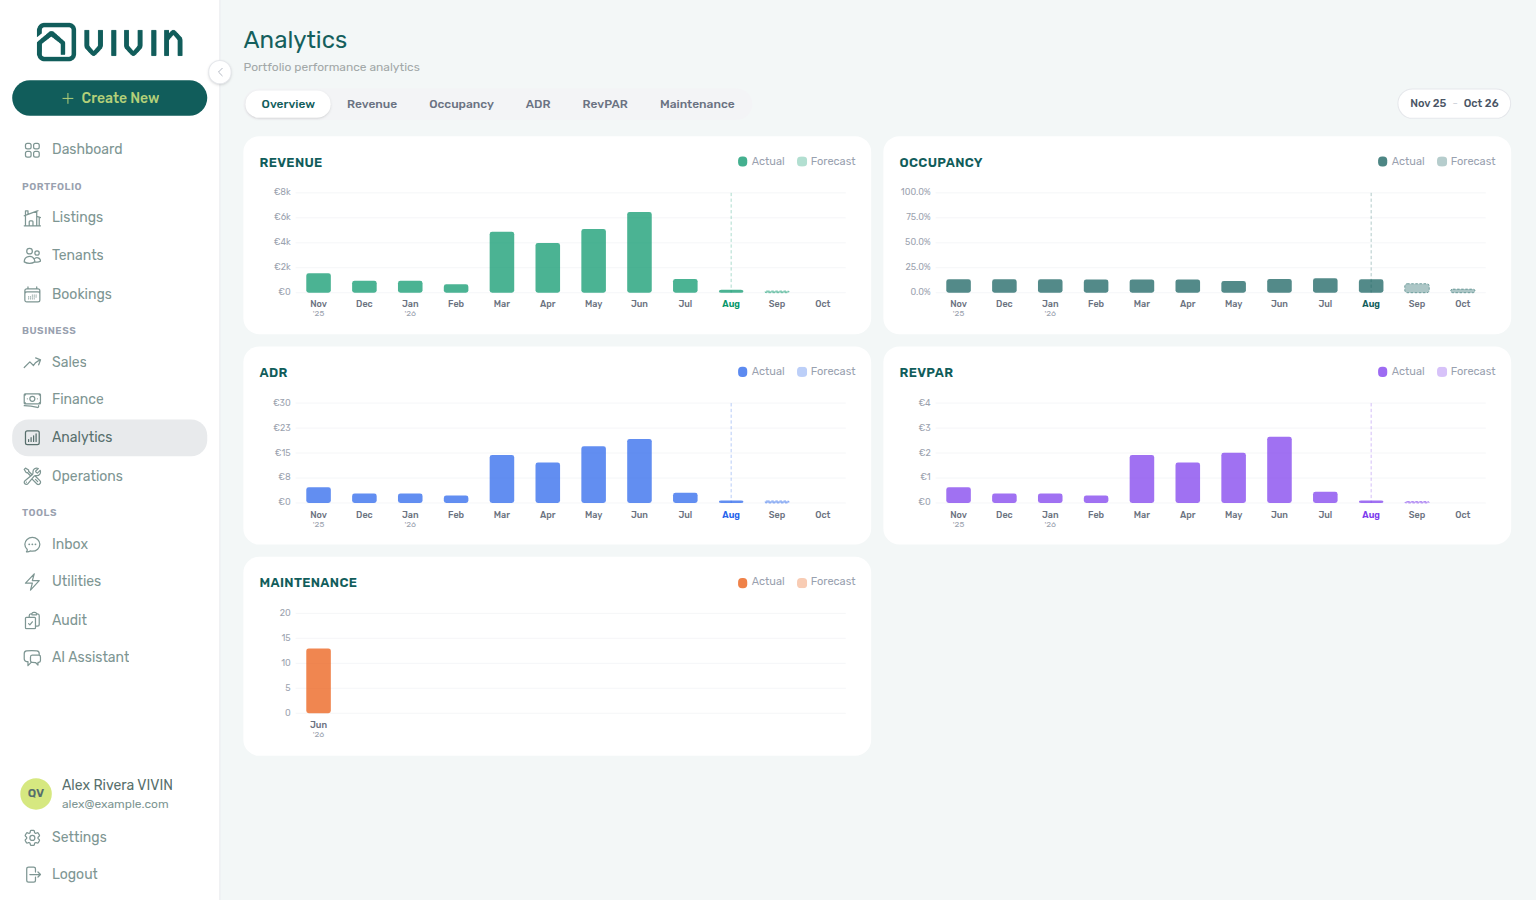
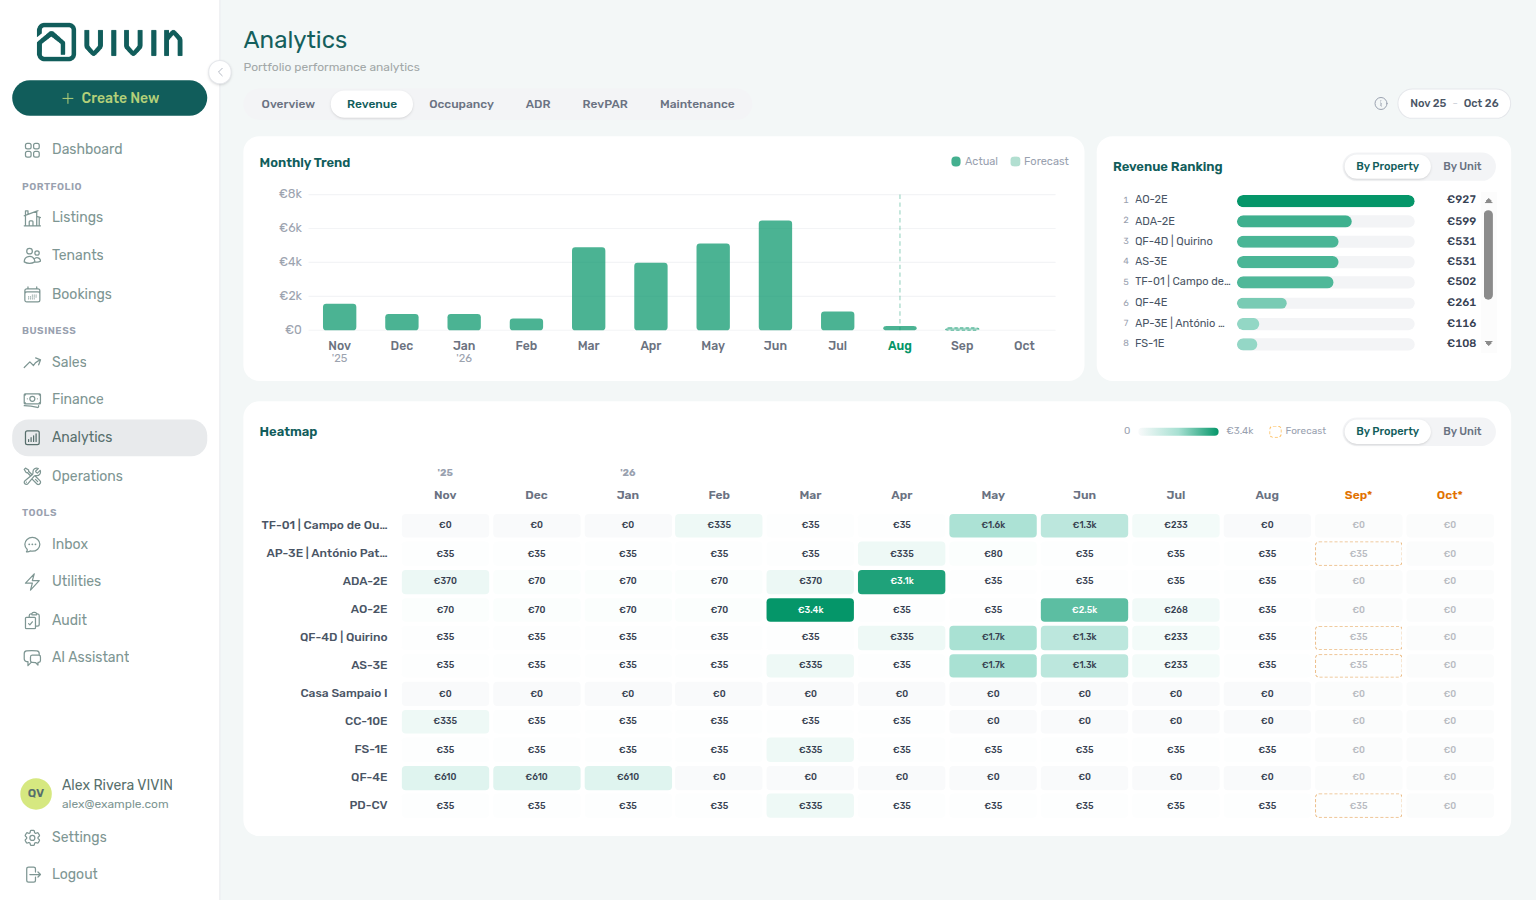
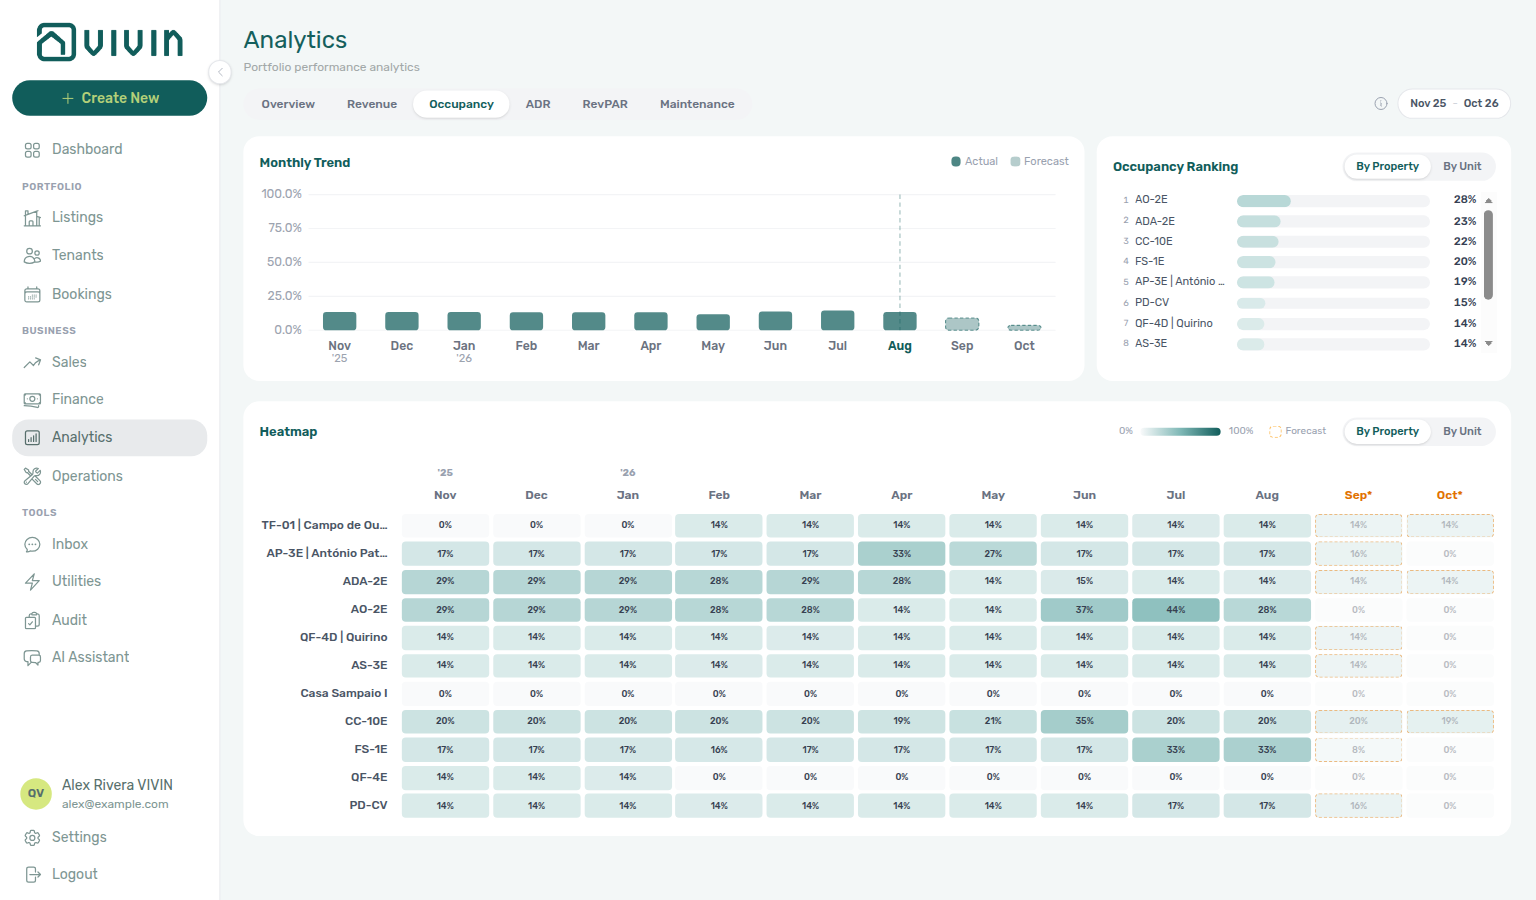
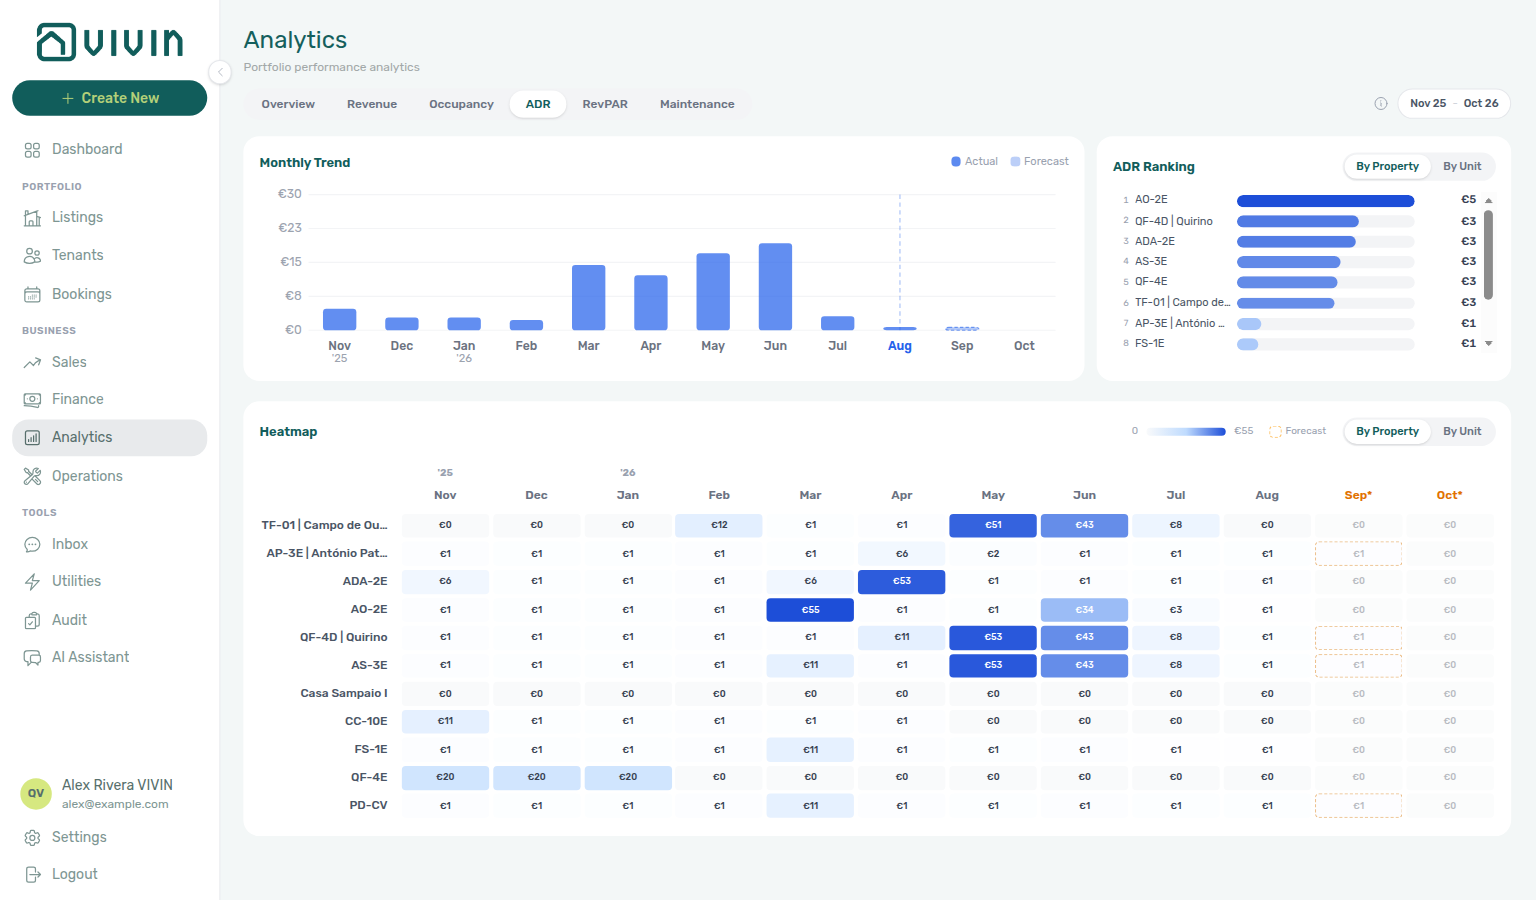
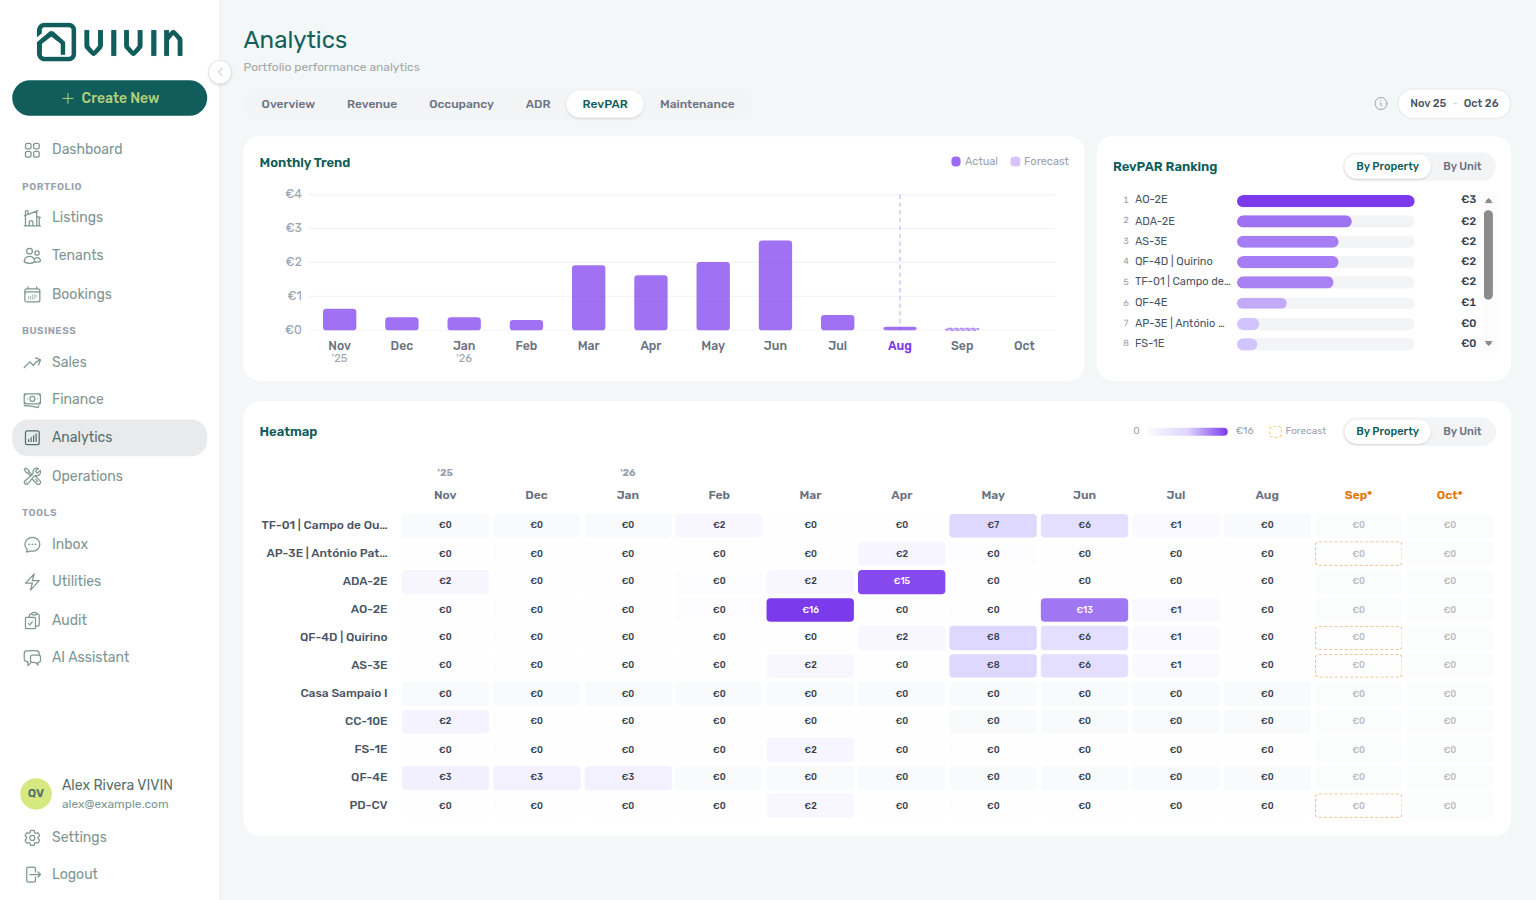
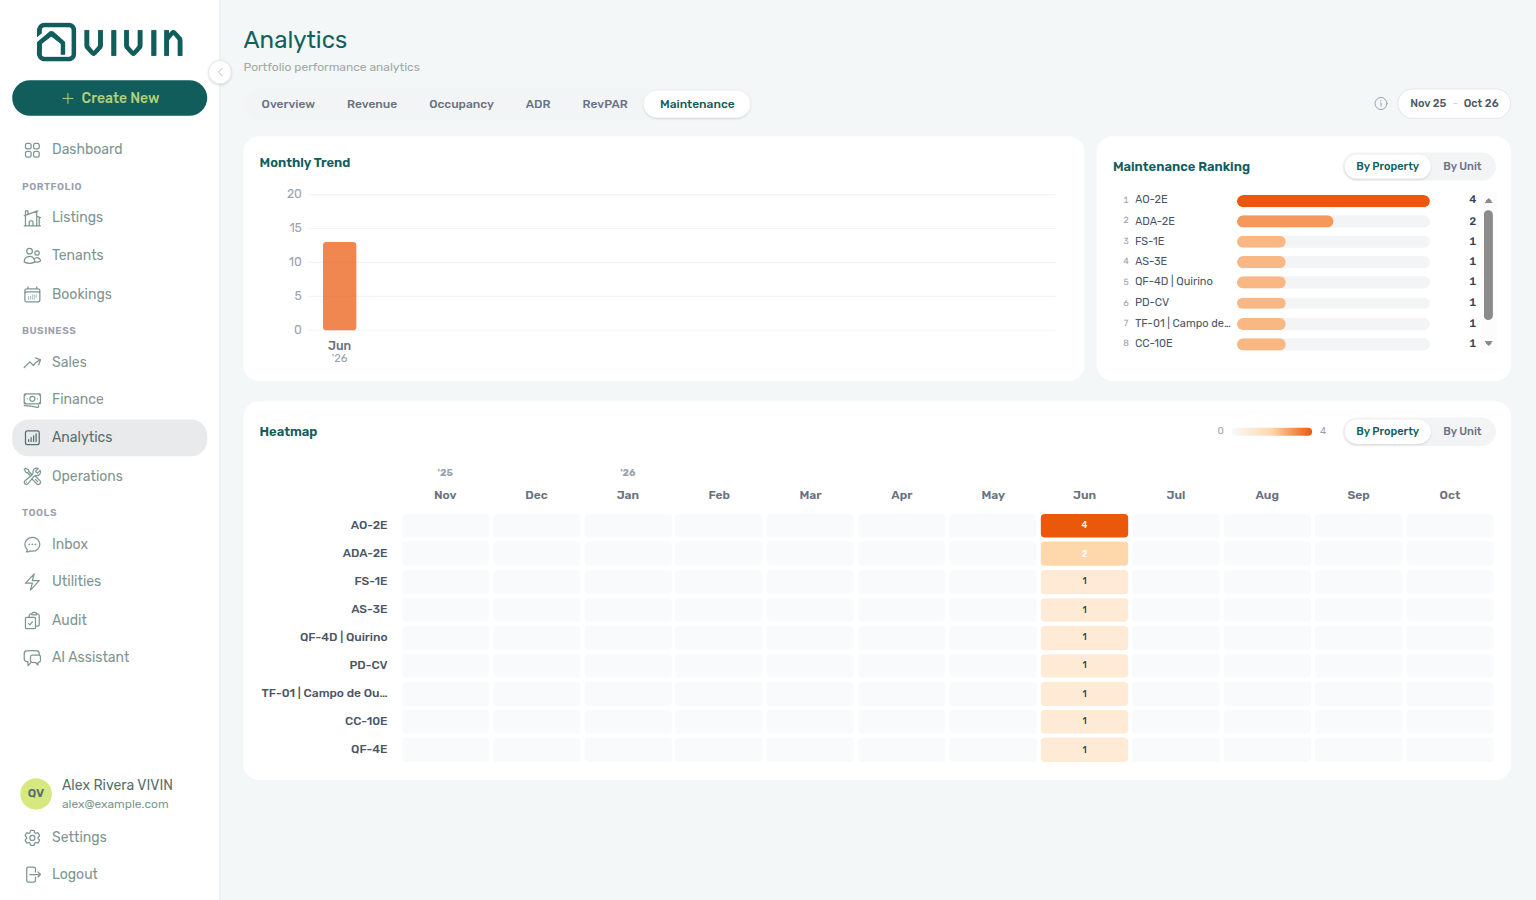
The ADR, RevPAR, and Maintenance tabs use the same three-part layout as Revenue and Occupancy: a wide Monthly Trend next to a Ranking card (top 20), then a full-width heatmap. ADR and RevPAR also offer By Property, By Unit, and (when applicable) By Owner on both ranking and heatmap; Maintenance is By Property or By Unit only. Large portfolios use the same ranking order on both widgets — see Ranking and heatmap paging.
Committed screenshots must stay operator-presentable — no [CLONE-*] names, obvious test strings, or distorted outlier rows in readable ranking or heatmap labels.
Tab overview
Tab grid pairs with Dashboard module and Portfolio KPI review — Step 2 — segment with Finance — Tenant category filter.
| Tab | Typical use |
|---|---|
| Overview | A single grid of bar charts for the selected range — revenue, occupancy %, ADR, RevPAR, and maintenance (operations tickets created per month in range) so you can scan trends side by side. |
| Revenue | Monthly trend (full portfolio in scope), ranking (top 20 of the portfolio-wide list), and revenue heatmap (ranked page + and N more when larger) — see Revenue, ADR, and RevPAR. |
| Occupancy | Same top-row split: monthly occupancy trend, occupancy ranking (top 20), then a seasonality heatmap; owner roll-up appears only with multiple owners. |
| ADR | Same layout as Revenue, for average daily rate: total revenue divided by occupied nights (see tab info tooltip). |
| RevPAR | Same layout as Revenue, for revenue per available night: total revenue divided by available nights (see tab info tooltip). |
| Maintenance | Tickets created per month in the selected range, ranking by property or unit (top 20, no owner mode), and a ticket count heatmap — see Maintenance tab. |
Tab names, tooltips, and numeric labels follow your interface language where the product localizes them; URLs and permission keys stay the same.
How amounts are formatted on charts
Portfolio monthly totals and large ranking values use compact EUR notation (for example 86,8 Mio. € in a de-DE locale) so axis ticks stay readable and are not misread as glued symbols. ADR and RevPAR use grouped euros for typical nightly rates and switch to compact notation only from €1M upward on axes and heatmaps. Tooltip and table cells follow the same rules. Your interface language affects separators and wording where the formatter localizes them.
Before charts render, the product caps extreme values used only for display on Revenue, ADR, and RevPAR trend bars and heatmaps when a corrupted balance would otherwise flatten the scale (for example monthly revenue above €100M or nightly rates above €5,000 are clipped to those ceilings). Real portfolio numbers stay unchanged in Finance and bookings; the cap restores readable axes. If you still see a flat or empty chart after a data fix, refresh the tab or change the month range so the workspace refetches.
Mistyped tab URLs (for example /analytics/foo) redirect to /analytics/overview so the address bar matches the tab you see — see Deep Links — Invalid, legacy, and mistyped URLs.
Revenue, ADR, and RevPAR tabs (shared layout)
Revenue, ADR, and RevPAR are implemented as one shared screen pattern:
- Top row — A two-column-wide Monthly Trend bar chart for the portfolio series, next to a one-column Ranking card. The ranking table lists up to 20 entities with mini comparison bars — always the top of the portfolio-wide ranked list for the roll-up you picked, not a random slice.
- Roll-ups — On both the Ranking card and the heatmap below it, use By Property, By Unit, and (when the portfolio has more than one linked owner) By Owner to change how rows are grouped. The ranking and heatmap each have their own roll-up control so you can compare different slices (for example rank by property while scanning unit-level seasonality). Changing a roll-up re-ranks the whole portfolio for that widget.
- Definitions — Open the information icon beside the date range for wording that matches the product: revenue counts rent plus admin and cleaning fees and excludes deposits and full refunds; ranking for property groups uses a simple average of each unit’s metric in that group (occupancy ranks night-weighted across the group); heatmap cells are month-by-row values with colour intensity for relative performance; forecast months use confirmed bookings for forward periods.
ADR and RevPAR reuse that exact structure; only the metric on the trend bars, ranking values, and heatmap colouring changes.
Ranking and heatmap paging
Large-portfolio ranking pairs with Revenue, ADR, and RevPAR tabs, Maintenance tab, and Portfolio KPI review — Step 3.
On Revenue, Occupancy, ADR, RevPAR, and Maintenance, the Monthly Trend always covers every listing in the current scope. The Ranking and Heatmap share that same scope, but they show a bounded ranked page so large portfolios stay readable:
| Widget | What you see |
|---|---|
| Monthly Trend | Portfolio totals for the month range — not limited to the rows visible in Ranking or Heatmap. |
| Ranking | Up to 20 rows from the top of the portfolio-wide ranked list for the selected roll-up (By Property / By Unit / By Owner). |
| Heatmap | A longer ranked page of the same order; when more entities exist in scope than that page holds, the table ends with and N more. |
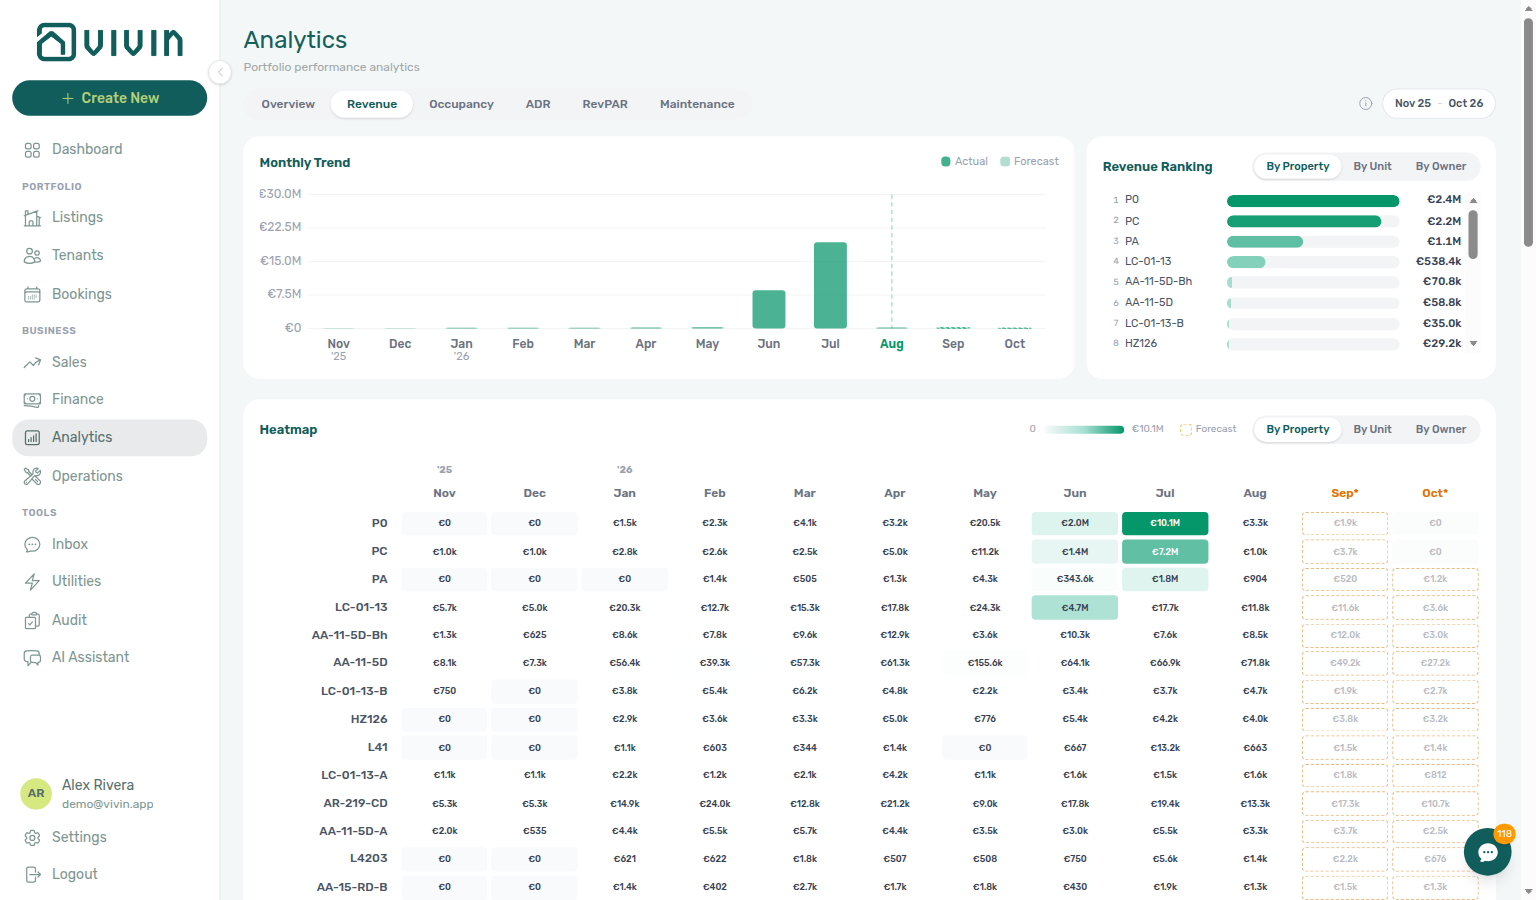
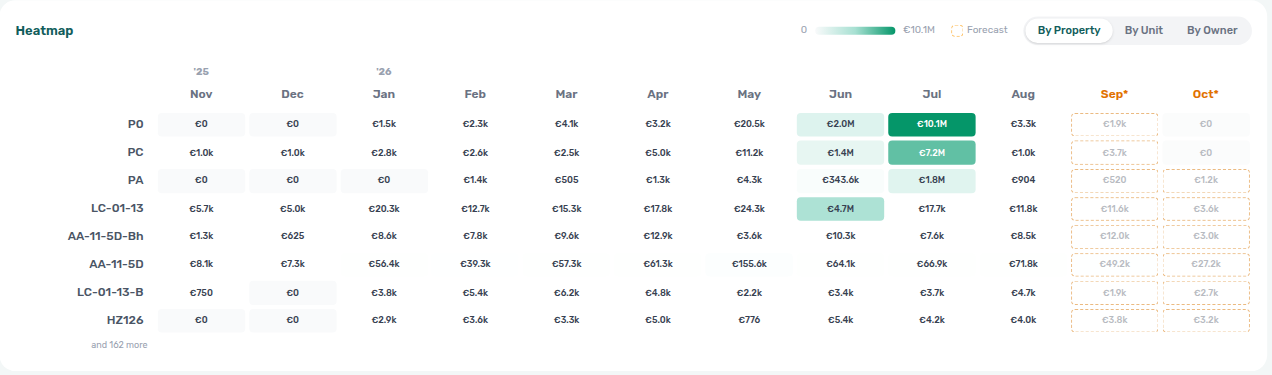
Why this matters: switching By Unit does not turn “top of the portfolio” into “top of whatever happened to load.” Vivin ranks across the full scope first, then fills Ranking and Heatmap from that ordered list. Headline monthly bars stay stable when you page or regroup the breakdown.
Ranking and heatmap loading
Loading placeholders pair with Ranking and heatmap paging and Portfolio KPI review — Step 1 — do not treat skeleton bars as a zero ranking.
On Revenue, Occupancy, ADR, RevPAR, and Maintenance, Monthly Trend and the Ranking / Heatmap cards are not one request:
| What you see | Meaning |
|---|---|
| Monthly Trend bars already drawn | Portfolio totals for the month range are ready. |
| Skeleton bars in Ranking (and a loading heatmap) | The ranked breakdown is still loading — wait; this is not an empty portfolio. |
| Ranking rows (top 20) and heatmap cells | Breakdown finished; roll-ups and paging work as in Ranking and heatmap paging. |
Changing By Property / By Unit / By Owner on Ranking or Heatmap starts a new breakdown request — expect the skeleton again briefly while Monthly Trend stays put. If Ranking never fills and shows a short “couldn’t load these rows” message with Retry, use that control (or reload the tab) before assuming every property ranks at zero.
Maintenance tab
Ticket trends pair with Operations module and Glossary — Draft ticket (display status) — Portfolio KPI review — Step 5.
The Maintenance tab answers “where are we opening the most operations tickets, and when?” using tickets whose created timestamp falls in the selected from–to range:
- Top row — Monthly Trend (ticket count per month across the whole scope) and Maintenance Ranking (top 20 of the portfolio-wide ticket ranking). Roll-up is By Property or By Unit only (By Owner is not offered on this tab).
- Heatmap — A full-width matrix of ticket counts by month and property or unit (again property / unit only), with a colour scale from zero to the portfolio maximum in view. Large portfolios end the table with and N more — same paging pattern as Ranking and heatmap paging.
- Definitions — Open the information icon beside the month-range picker for How Maintenance works: ticket counts per month, how ranking totals are grouped, and how heatmap colour intensity reflects relative ticket volume (same pattern as the metric tabs).
For ticket workflows in the product (assignments, checklists, and exports), use the Operations module.
How Analytics differs from Sales
Choose Analytics for portfolio roll-ups and Sales for listing-centric calendars — see FAQ — Analytics (KPI workspace) when figures disagree with Sales, Dashboard, or Finance. Pair month-end reconciliation with Portfolio KPI review and FAQ — Dashboard Total Debt subtitle.
| Question | Use Analytics | Use Sales |
|---|---|---|
| Scope | Whole portfolio (and roll-ups by property / unit / owner) | Individual listings, calendars, channel rows |
| Time lens | Multi-month from–to range | Availability windows, heatmaps, listing-centric pricing |
| Primary decisions | Portfolio health, trends, investor-style KPIs | Gaps, nightly/monthly prices, channel manager actions |
Analytics guide subsection index
Analytics section cross-reference
Use the sections above for this module. Related pages are linked from Related below when present, or from Modules.
Related
Related below links this module to settings, concepts, workflows, and escalation paths.
Documentation map & escalation
- Modules hub — Hub pairing matrix across operator workspaces
- Portfolio KPI review — Month-end walkthrough across Analytics, Dashboard, Sales, and Finance
- Glossary — Term definitions used across KPI reconciliation
- FAQ — Analytics (KPI workspace) — When figures differ from Sales or the Dashboard
- Get Help & Support — Escalate when Analytics fails to load or permissions block access
Upstream & downstream workflows
- Manual block hygiene — Audit pass when occupancy or RevPAR dips without an obvious rate change
- Entering Monthly Utility Bills — Close Missing bill gaps before trusting Revenue or occupancy trends
- Handling a Late Payment — Step 1 — Collections when debt-aging or revenue charts spike during KPI review; upstream path from Notifications — Payment overdue alerts
- Notification triage — Clear KPI-threshold alerts after month-end review
- Managing a Check-out & Deposit Refund — Month-end deposit retention trends after KPI review surfaces overdue refunds
Deeper workflow reads
See Upstream & downstream workflows above for the same guides.
Navigation & bookmarks
Bookmark routes pair with Management Frontend Deep Links and Create New menu.
- Management Frontend Deep Links — Analytics — Full URL table including
/analyticsdefaults and unknown-path behaviour - Modules overview — Where Analytics sits next to Finance and Operations in the product shell
Settings that shape Analytics
- Settings > Users and roles — Analytics module permission (
analytics.module) - Settings > Preferences — Booking defaults — Preparation-day defaults that affect occupancy calculations
- Settings > Preferences — In-app notifications — Account-wide alert categories before you triage KPI-threshold notifications during month-end review
- Settings > Categories — Tag/type vocabulary on Sales and Finance filters during weak-metric segmentation
- Settings > Tenant categories — Segment portal rules and Finance — Tenant category filter when Step 6 isolates one tenant segment
- Settings > Emails — Communication Rules to audit when KPI charts disagree with payment-reminder delivery
Deeper concept reads
- Booking lifecycle — Computed booking status filters when reconciling occupancy charts with Bookings list counts
- Integrations & Distribution — Reconcile occupancy and revenue charts with multichannel imports and iCal blocks
- Tenant Portal — Portal adoption and online-payment trends to cross-check against Income and debt KPIs
- FAQ — Tenant contract signing blocked — No PDF yet, mandatory Your Details gates, category locks, or Lease purpose; portal signing vs paper upload on Contract Info
- Services Marketplace — Ancillary portal revenue to reconcile against Income and occupancy KPIs during month-end review
- Payment Allocation — Two-layer receipts, invoiced-floor rent edits, and credit note reject/revert warnings
- Landlord MCP — External portfolio tools that may answer occupancy or revenue questions from the same KPI data
- Automation & AI — In-product AI Chat and MCP clients to cross-check KPI answers
Operator modules (pairing surfaces)
- Dashboard Module — Same-day snapshot when Analytics is slow or unavailable
- Sales Module — Per-listing availability and pricing (complements portfolio KPI charts)
- Finance Module — Overview tab — Receivables and income-status drill-down when revenue charts disagree
- Listings — Portfolio toolbar — Tag and type filters that pair with Analytics occupancy drill-downs
- Audit Module — Cross-portfolio manual blocks when occupancy or RevPAR dips without an obvious rate change
- Audit — Discounts tab — Portfolio-wide discount KPIs and export when Revenue or margin charts need contract-value triage
- Inbox module — WhatsApp volume that can skew Maintenance tab ticket counts during KPI review
- Notifications — Payment overdue alerts — Operator Payments category rows when month-end Revenue charts disagree with receivables
- Utilities module — Bill gaps that skew Revenue and occupancy trends
- Finance — Tenant category filter — Reconcile Contract Values In Debt or Deposits for the same segment after Occupancy or Ranking dips (Step 6)
- Tenants module — Demographic directory when occupancy charts need tenant-segment context
- AI Chat module — Assistant summaries to reconcile against KPI charts during review
- Properties workspace — Legacy
/propertiesURLs that still appear in older bookmarks during KPI review
Operator habit hubs
Day-to-day operator habits (lockout catch-up, pending receipts, payment triage, handoffs, and related playbooks) live on the Common Workflows habit hub.
Deep-link anchors for habit hubs
Lockout catch-up after password recovery
Pending manual receipt approval
Reject/revert mistaken receipts
Check-out ledger cleanup before refund
Utility overage collections
Cancellation collections before void
Check-out collections before refund
Handling a Late Payment collections
Check-out vs cancellation
Deposit missing on Finance Deposits
Notification row-click navigation
Payment alert to receivables triage
Finance debt receivables triage
Finance Income status drill-down
Cash flow forecast drill-down
Confirmation alert triage
New inventory to first booking handoff
Property setup to first arrival handoff
Confirmation to check-in handoff
Check-in to check-out handoff
Check-out final utilities handoff
Same-day turnover coordination
WhatsApp per-booking messaging
Bot reasoning (audit)
ChatBot settings
Rent reduction after invoicing
Occupancy KPI to block hygiene handoff
Partly collected security deposit
Month-end invoicing (fixed date)
Bulk Hostkit invoicing
Portfolio segmentation by tenant category
Directory list refresh
When a list needs a refresh instead of showing rows, use Retry or reload the page. Zero rows after a successful load means your filters matched nothing — widen filters or clear search.
See FAQ — Directory list refresh and Glossary — Directory list refresh.
Key glossary terms
- Glossary — End-of-Booking cost split — Charge Time → End of Booking splits daily overage across every occupied unit; still-staying roommates stay in the denominator
- Glossary — Change history — Operator-initiated edits on Listings setup and Bookings Changelog; create-time defaults excluded
- Glossary — Archived booking ledger visibility — Delete Booking hides manual/provider_platform rows on Finance → Transactions; vIBAN and credit card stay visible
- Glossary — Finance tenant category cache refresh — Recategorizing a tenant updates
booking.tenantCategoryIdimmediately; ledger tabs reflect it on reload, while Overview can lag up to ~10 minutes - Glossary — SIMAR water contract ID — SIMAR (Loures e Odivelas) water bills use Cód. Local in Connections — not Nº de Contador; leading zeros stripped
- Glossary — Per-booking maintenance ticket opt-out — Add booking checkboxes skip automatic CI/CO tickets for one reservation only; property rule unchanged
- Glossary — Full term list
API & companion guides
- API Reference — Listings & Availability — Partner partial pulls to reconcile with Occupancy and RevPAR charts during month-end review
- API Reference hub — Partial vs full feed depth when channel sync disagrees with KPI trends
Module documentation hubs
- Analytics module — Hub for month-range portfolio KPI workspace with tabbed charts, rankings, and heatmaps (this page)
- Dashboard module — Post-login Today, Total debt, Vacant Units, and forecast KPI snapshot with bell notification triage (hub)
- Listings module — Property wizard, Channels tab, Archived inventory, and unit management (hub)
- Finance module — Portfolio ledgers (Overview, Income, Contract Values, Transactions, Payouts, Deposits) with payment approval and deposit settlement (hub)
- Tenants module — Tenant directory, profile sidebars, With Debt segmentation, and table expand for linked bookings (hub)
- Sales module — Portfolio availability, monthly rent editing, and channel manager connections (hub)
- Operations module — Maintenance tickets, cash flows, check-in/out coordination, Draft ticket queues, and linked cash flows (hub)
- Utilities module — Bills Included ceiling model, Connections, AI bill upload, and tenant overage charges on payment plans (hub)
- Inbox module — Portfolio-wide WhatsApp workspace with Dashboard bell Inbox sub-tab deep links (hub)
- Notifications module — Full
/notificationshistory with search, filters, and row-click navigation (hub) - AI Chat module — AI Assistant using Landlord MCP tools for portfolio Q&A (hub)
- Audit module — Portfolio-wide Manual Blocks and Discounts contract-value review (hub)
- Properties workspace — Legacy
/propertiesURL redirects into Listings (hub) - Booking engine details — Rich marketplace payload editor via the Full integration pill (hub)
- Account Settings — Workspace-wide financial policies, templates, integrations, and operational defaults (hub)
- API Reference hub — Partner HTTP contracts, Swagger onboarding, and partial vs full feeds (hub)