Dashboard
You land on Dashboard after sign-in, but complete Getting Started — Recommended Setup Sequence (steps 1–12 per Recommended setup order, then steps 13–15 in Listings, Bookings, and Tenants) before you rely on KPI cards for account-wide decisions. After go-live, pair daily triage with Portfolio KPI review and Notification triage. Lockout catch-up: Getting Started — Lockout catch-up after password recovery. Workflow pairing: Modules — Setup sequence after go-live.
Start with KPI cards (top-left grid) for the daily snapshot, then Occupancy Forecast and the second-row Cash Flow Forecast + Vacant Units. Triage the Notifications bell (desktop) into Notifications and follow Recommended daily operator flow for the standard scan order. Guide subsection map: Dashboard guide subsection index (widget sections + Related subsections). Non-linear operator habits (Lockout catch-up, Pending manual receipt approval, Notification row-click navigation, Payment alert to receivables triage, Confirmation alert triage, Finance debt receivables triage, Finance Income status drill-down, Cash flow forecast drill-down, Reject/revert mistaken receipts, Partly collected security deposit, Portfolio segmentation by tenant category) have matching Related subsections below. Full pairing matrix: Dashboard section cross-reference · Modules — Module cross-reference.
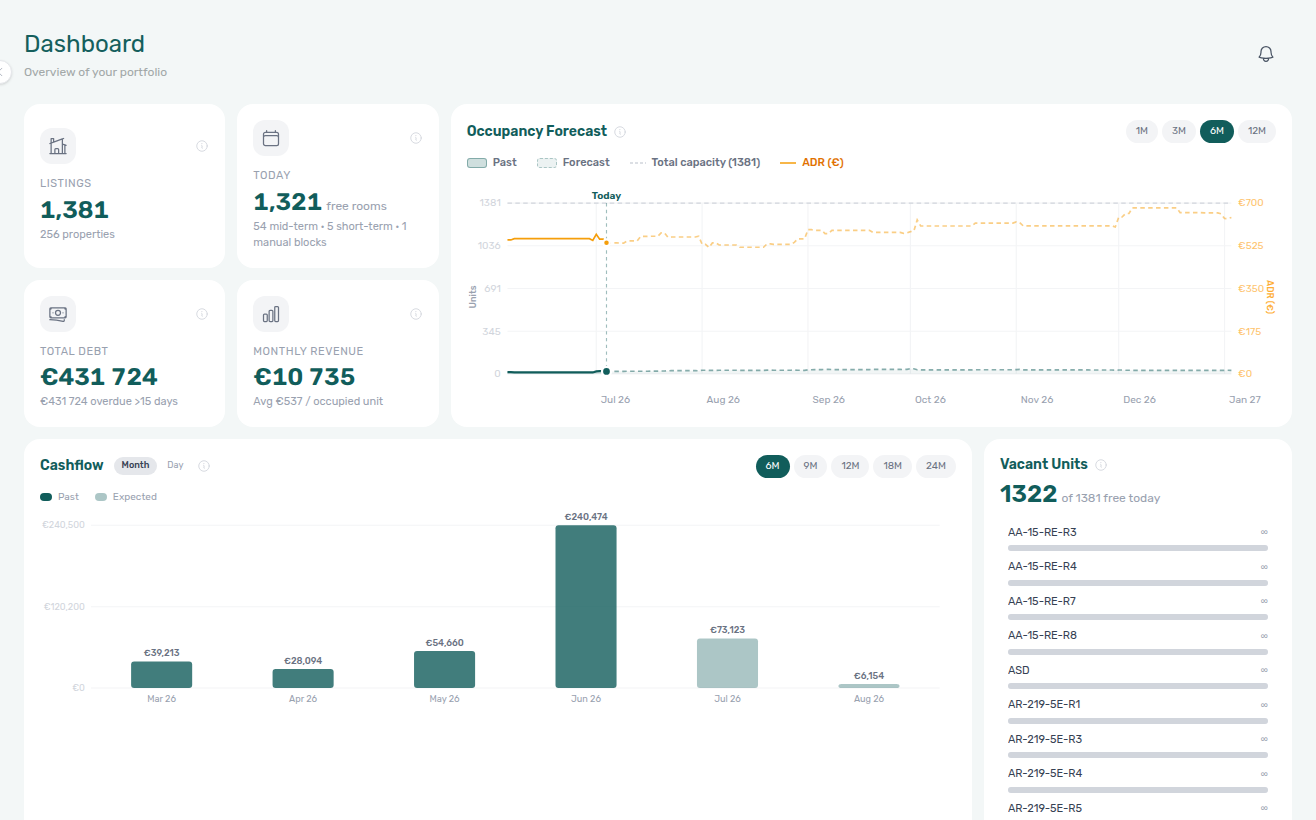
The Dashboard is the first screen after login and gives operators a live snapshot of portfolio performance and financial health.
Reconcile KPI cards with Analytics month-range charts and Finance Debt Aging; pair Sales occupancy heatmaps when Vacant Units disagrees with channel availability. When Total Debt or Monthly Revenue spikes for one tenant segment, scope Finance — Tenant category filter (or Bookings — Other filters) before account-wide rate or portal changes — same habit as Portfolio KPI review — Step 6. Poll AI usage API during Portfolio KPI review — Step 7 when landlord_chat or utility_bill_extraction volume should explain operational cost alongside debt reconciliation. When the header bell or /notifications surfaces a payment overdue row, continue with Handling a Late Payment — Step 1. Full pairing matrix: Modules — Module cross-reference.
Open the Dashboard directly at platform.vivin.app or platform.vivin.app/. See Deep Links for all management frontend routes.
The capture above emphasizes the top row (KPI cards + Occupancy Forecast). On shorter laptop screens the main workspace may require a small downward scroll to bring Cash Flow Forecast and Vacant Units into view — they stay on the same / route, not a separate page. The image in Vacant Units shows the second row with the full management shell at desktop width.
Total Debt, Monthly Revenue, Occupancy Forecast, and Cash Flow Forecast closeups refreshed 2026-06-12 11:04 UTC (VIVIN_DOCS_BASE_URL=http://localhost:5173 VIVIN_DOCS_RECORD_API=$VITE_API_BASE_URL npx tsx tools/capture-dashboard-kpi-closeups.ts and tools/capture-dashboard-forecast-chart-closeups.ts). Full-page dashboard-overview-current.png refreshed 2026-07-04 00:05 UTC (tools/capture-dashboard-overview-screenshot.ts). dashboard-vacant-units-listing-sidebar.png refreshed 2026-07-04 00:05 UTC (tools/capture-dashboard-vacant-listing-sidebar.ts). Second-row dashboard-cash-flow-and-vacant-units-row.png refreshed 2026-07-03 23:01 UTC (tools/capture-dashboard-cash-flow-vacant-units-row-screenshot.ts). Partial load failure banner PNG refreshed 2026-06-15 04:11 UTC (tools/capture-dashboard-partial-load-failure.ts).
The current layout is organized into two rows:
- Top row: four KPI cards + Occupancy Forecast
- Bottom row: Cash Flow Forecast + Vacant Units
Partial data load failures
Load-failure banners pair with Glossary — Directory list load failures and FAQ & Troubleshooting before you escalate — other widgets may still show cached KPIs. Full pairing matrix: Dashboard section cross-reference.
If the shared portfolio aggregate that feeds the Dashboard fails to load, a red-bordered alert appears directly under the page header: Some dashboard data failed to load. with optional server detail and a Retry button. Other widgets that already rendered from cache may remain visible — use Retry or refresh the page before assuming KPI figures are current. This pattern is separate from per-module directory errors documented under Glossary — Directory list load failures.

Partial-load banner capture refreshed 2026-06-15 04:11 UTC (VIVIN_DOCS_BASE_URL=http://localhost:5173 VIVIN_DOCS_RECORD_API=$VITE_API_BASE_URL npx tsx tools/capture-dashboard-partial-load-failure.ts — simulates GET /app-loader/overview/stats failure; crops the alert only so KPI clone markers on staging do not block the asset).
KPI cards (top-left grid)
Total Debt and Monthly Revenue pair with Finance — Overview and Handling a Late Payment — Step 1 when payment overdue alerts row-click into bookings; Today pairs with Sales — Overview and Vacant Units. Segment spikes: Finance — Tenant category filter. Full pairing matrix: Dashboard section cross-reference.
Card-by-card definitions and committed PNG closeups: Glossary — Dashboard KPI cards. Distinct from the seven-card Finance → Overview strip.
The KPI card area contains these four cards:
| UI label | What it tells you |
|---|---|
| Listings | Total number of rentable listings. Subtitle shows the number of properties. |

| Today | Headline: how many listings count as free rooms today (suffix free rooms in the UI). Subtitle: only when at least one occupied-side bucket is non-zero, the card shows mid-term stays, short-term (channel) stays, and manual blocks (manual or channel calendar blocks), each as its own segment joined by ·; segments with zero are omitted, so an all-free day often has no subtitle line. Hover the card’s info icon for the full rules (each listing counted once; calendar rows tied to a booking are ignored for these subtitle totals). Refunded-but-active stays still count as occupied for this headline so the free-room count matches Sales → Overview and Multicalendar Available now — revenue and debt KPIs on the same page keep using non-refunded booking sets. |
The Today count is recomputed on each page load so it stays aligned with Sales → Overview Today and Multicalendar → Available now, even when other Dashboard widgets still come from cached snapshots refreshed on a schedule. After a booking ends, is canceled, or a manual block is added, refresh the page (or wait for the toolbar refresh indicator) before you treat a stale free-room number as authoritative. When Preferences → Vacant Unit Preference is Include manual blocks, manually blocked but unbooked listings count toward Today the same way they do on Sales → Available Now; OTA/iCal blocks and booking-linked holds still occupy the unit.

| Total Debt | Total tenant underpayment (negative balance) summed for ongoing bookings only — same notion Finance uses for “total debt” on live stays. Subtitle shows the € amount of that debt on bookings older than 15 days (not the whole debt figure repeated). Hover the info icon for the in-app definition of ongoing bookings and overdue debt. |
| Monthly Revenue | Sum of monthly rent from ongoing bookings. Subtitle shows average monthly rent per occupied unit; the card tooltip also notes month-over-month trend. |

Use these cards for a quick daily check of supply, utilization pressure, and receivables risk.
Card titles and segments such as free rooms, mid-term, short-term, and manual blocks follow your interface language — the behaviour described here matches the English management app.
The Total Debt KPI matches Finance’s “total debt” logic for ongoing bookings. The card subtitle is the portion of that ongoing debt on stays older than 15 days — see FAQ — Dashboard Total Debt subtitle — hover the info icon for the in-app rules (illustrated in dashboard-kpi-total-debt-tooltip.png). Until Approve payments clears pending manual receipts, headline and subtitle may lag recorded bank deposits — FAQ — Pending manual in-payment on /notifications, Glossary — Pending manual in-payment (Finance). The Finance Overview Total Debt card uses the same balance rule but includes ended bookings in the all-time headline — use Finance > KPI strip for the full receivables picture, Uncovered Debt, and Manual Payments context, and the Dashboard card for live-portfolio risk at a glance. For booking-level rows, open Debt Aging on Finance — FAQ — Bookings that owe money. Reconcile both during Portfolio KPI review — Dashboard Total Debt subtitle, Notification triage — Step 4 (alert-driven entry), and Handling a Late Payment — Step 1. See FAQ — Dashboard Total Debt subtitle, Glossary — Dashboard KPI cards, and Glossary — Uncovered Debt.
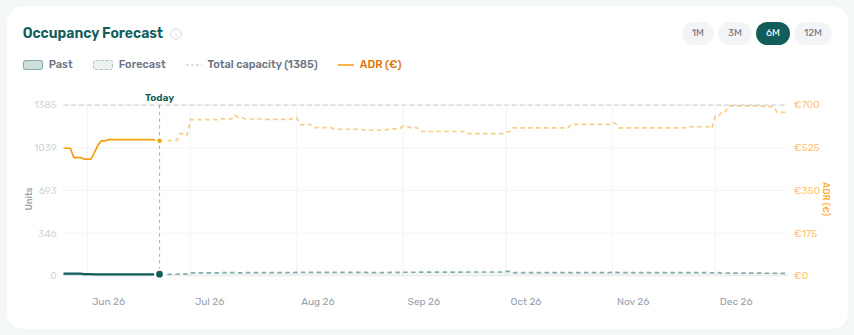
Occupancy Forecast
Occupancy gaps here pair with Analytics — Occupancy tab, Sales — Multicalendar, and Manual block hygiene when blocks suppress counts — reconcile during Portfolio KPI review — Step 6. Full pairing matrix: Dashboard section cross-reference.
Chart behaviour, horizon controls, and ADR (€) legend: Glossary — Occupancy Forecast (Dashboard). Distinct from month-range Analytics — Occupancy and from Finance Overview cash flow (collections history).
The Occupancy Forecast chart (top-right) combines a short Past strip with a Forecast segment on one continuous timeline.
- Past and Forecast share the same date axis; the vertical “today” marker separates them.
- Each day shows how many listings count as occupied from active (non-canceled) bookings, using each booking’s occupancy span (including listing unavailability windows when they apply).
- Legend/context lines include Total capacity and ADR (€) — ADR is the average monthly rent among units counted occupied that day.
- Horizon buttons 1M, 3M, 6M, 12M set how far forward the chart runs in calendar months from today (not a fixed “months × 30 days” window).
Both forecast charts use the same timeline math:
- Forward: through the end of N calendar months from today (matching the selected 1M / 3M / 6M / 12M).
- Past: a short look-back whose length scales with that selection but stays capped so longer horizons (for example 6M or 12M) do not stretch the past portion of the axis unrealistically.
Hover the chart title’s info icon in the product for the in-app summary.
Use this chart to identify upcoming occupancy gaps and compare them with expected pricing efficiency.
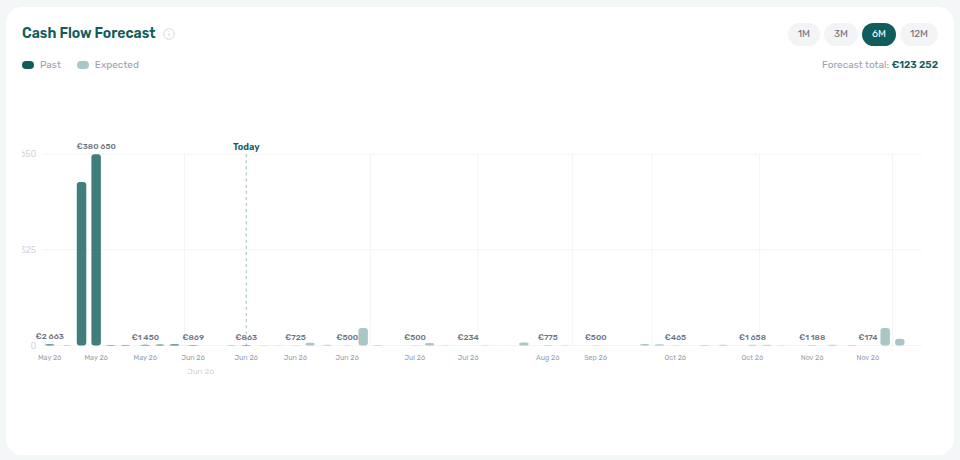
Cash Flow Forecast
Rent-due timing pairs with Finance — Contract Values and Settings > Invoicing & Payments — Payment deadlines — distinct from Operations — Cash Flows expenses and from Finance — Cash flow forecast confirmed collections history (Cash flow forecast drill-down). Collections follow-up: Handling a Late Payment. Full pairing matrix: Dashboard section cross-reference.
Rent-due timing chart vs Operations expenses and Finance collections: Glossary — Cash Flow Forecast (Dashboard).
Cash Flow Forecast here is the Dashboard rent-due chart only. Operations → Cash Flows is a different feature: booking-unrelated income and expense lines your team records. The Glossary spells out both under Cash Flow and Cash Flow Forecast (Dashboard) (letter C).
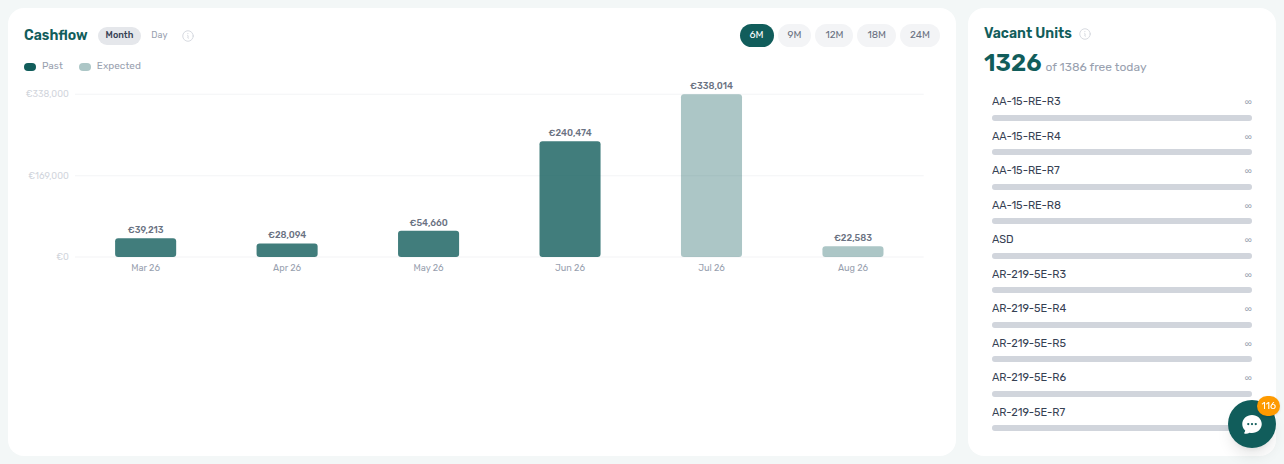
The Cash Flow Forecast chart (bottom-left) visualizes expected rent on each calendar day in the same timeline window as Occupancy Forecast.
- For each day, the chart sums monthly rent from active (non-canceled) bookings whose contract covers that day and whose due day (rent collection day) matches that calendar date — so spikes align with when rent is due, not necessarily when cash is banked.
- Past (darker bars) vs Expected (lighter bars) follows the today marker; amounts before today are still “expected” in the modeling sense but styled as historical context.
- The horizontal axis compresses days with zero due rent and expands days with payments so due dates stay readable when the range is long.
- Forecast total (top-right of the chart card) is the sum of expected amounts from after today through the end of the selected forward window.
- Uses the same 1M / 3M / 6M / 12M horizon controls as Occupancy Forecast.
Hover the chart title’s info icon for the in-app explanation.
Use this chart to estimate near-term cash availability and spot weaker collection periods.
Vacant Units
Vacancy prioritization pairs with Listings — unit sidebar, Sales — Overview tab, and Audit when Manual block hygiene explains suppressed Today counts. Full pairing matrix: Dashboard section cross-reference.
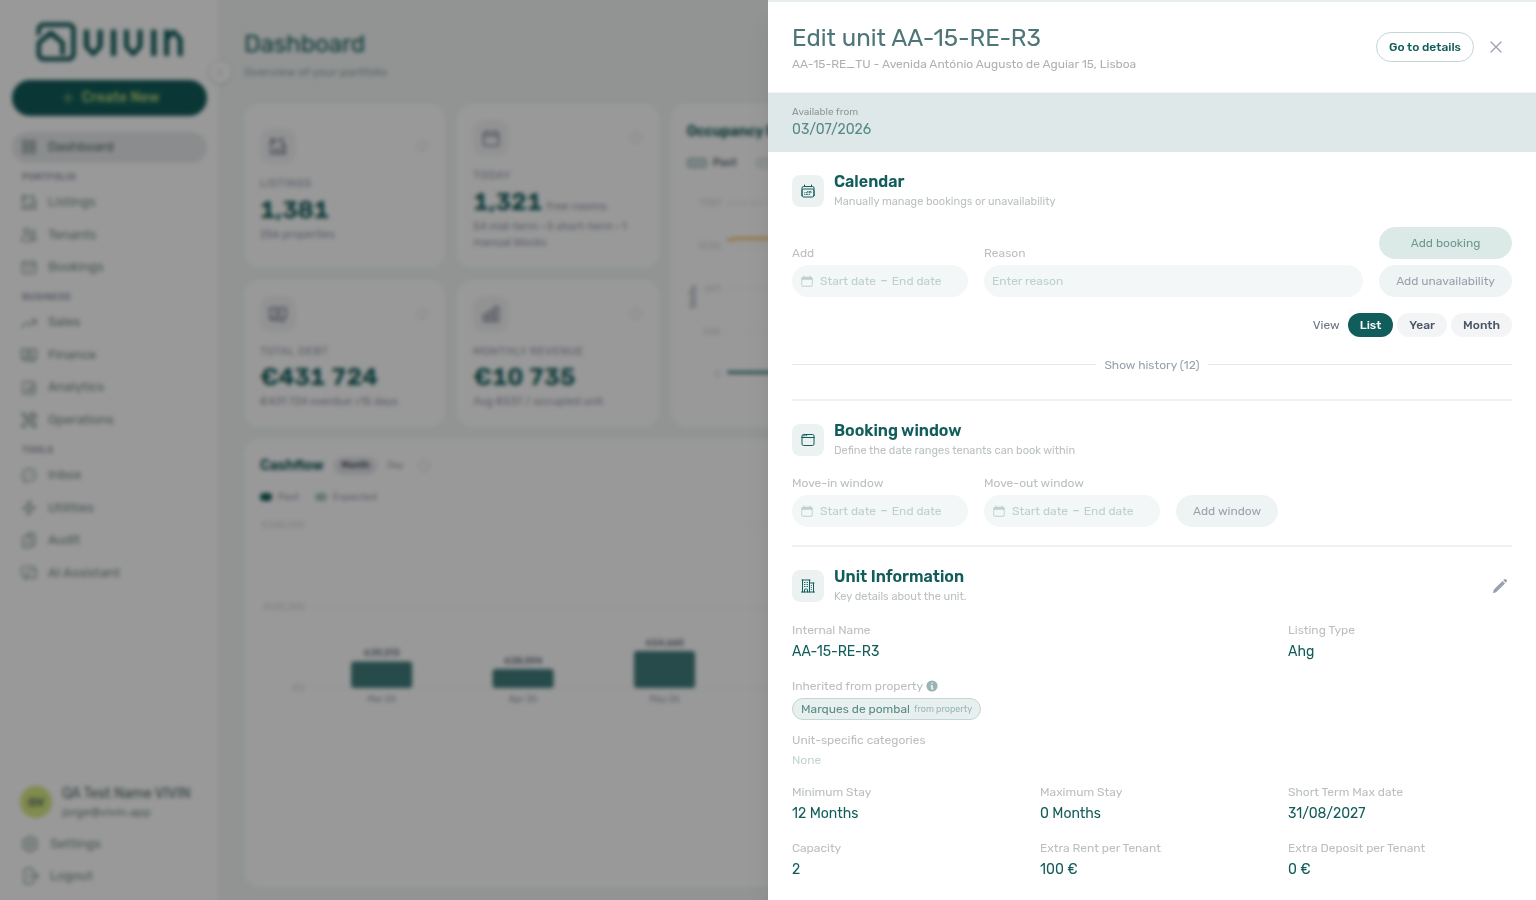
The Vacant Units panel (bottom-right) highlights listings that are free today: no active booking and, by default, no manual block on that listing. When Preferences → Vacant Unit Preference is Include manual blocks, a manually blocked but unbooked unit can appear here (physical-occupancy view); OTA/iCal blocks and booking-linked unavailabilities still exclude the row. Illustrated panel behaviour: Glossary — Vacant Units (Dashboard).
- Headline value shows how many units are free today.
- List is sorted by consecutive free days from today (longer projected availability appears first).
- Each row includes a relative vacancy bar for quick prioritization.
- Click a row to act on that unit without leaving the Dashboard:
- Roles with Listings edit access open the same listing edit sidebar used in the Listings module in place over the Dashboard (availability, pricing, and setup fields — close with the sidebar’s dismiss control to return to the snapshot).
- View-only listing access (no edit permission) navigates to the deep-linkable unit route
/listings/unit/:listingIdinstead.
Use this panel to prioritize commercial actions on units with prolonged vacancy, then open the listing sidebar or unit page directly from the row you care about.
When Today or Vacant Units counts look lower than Sales or Analytics occupancy suggests, run Manual block hygiene or cross-check Audit for stale manual blocks that still suppress availability — see Portfolio KPI review.
Second-row capture (dashboard-cash-flow-and-vacant-units-row.png) refreshed 2026-07-08 05:13 UTC (VIVIN_DOCS_BASE_URL=http://localhost:5173 VIVIN_DOCS_RECORD_API=$VITE_API_BASE_URL npx tsx tools/capture-dashboard-cash-flow-vacant-units-row-screenshot.ts). Vacant-units sidebar capture (dashboard-vacant-units-listing-sidebar.png) refreshed 2026-07-04 00:05 UTC (tools/capture-dashboard-vacant-listing-sidebar.ts).
Notifications bell (desktop)
Bell triage pairs with Notifications module, Inbox module (Inbox sub-tab), and Notification triage — payment overdue rows on General continue to Handling a Late Payment — Step 1. Most General bell rows open Notification detail in-panel; use /notifications for row-click into Bookings / Tenants / Listings — see Notification row-click navigation, Payment alert to receivables triage, Confirmation alert triage, FAQ — Notification row-click navigation, and Glossary — Notification row navigation. Full pairing matrix: Dashboard section cross-reference.
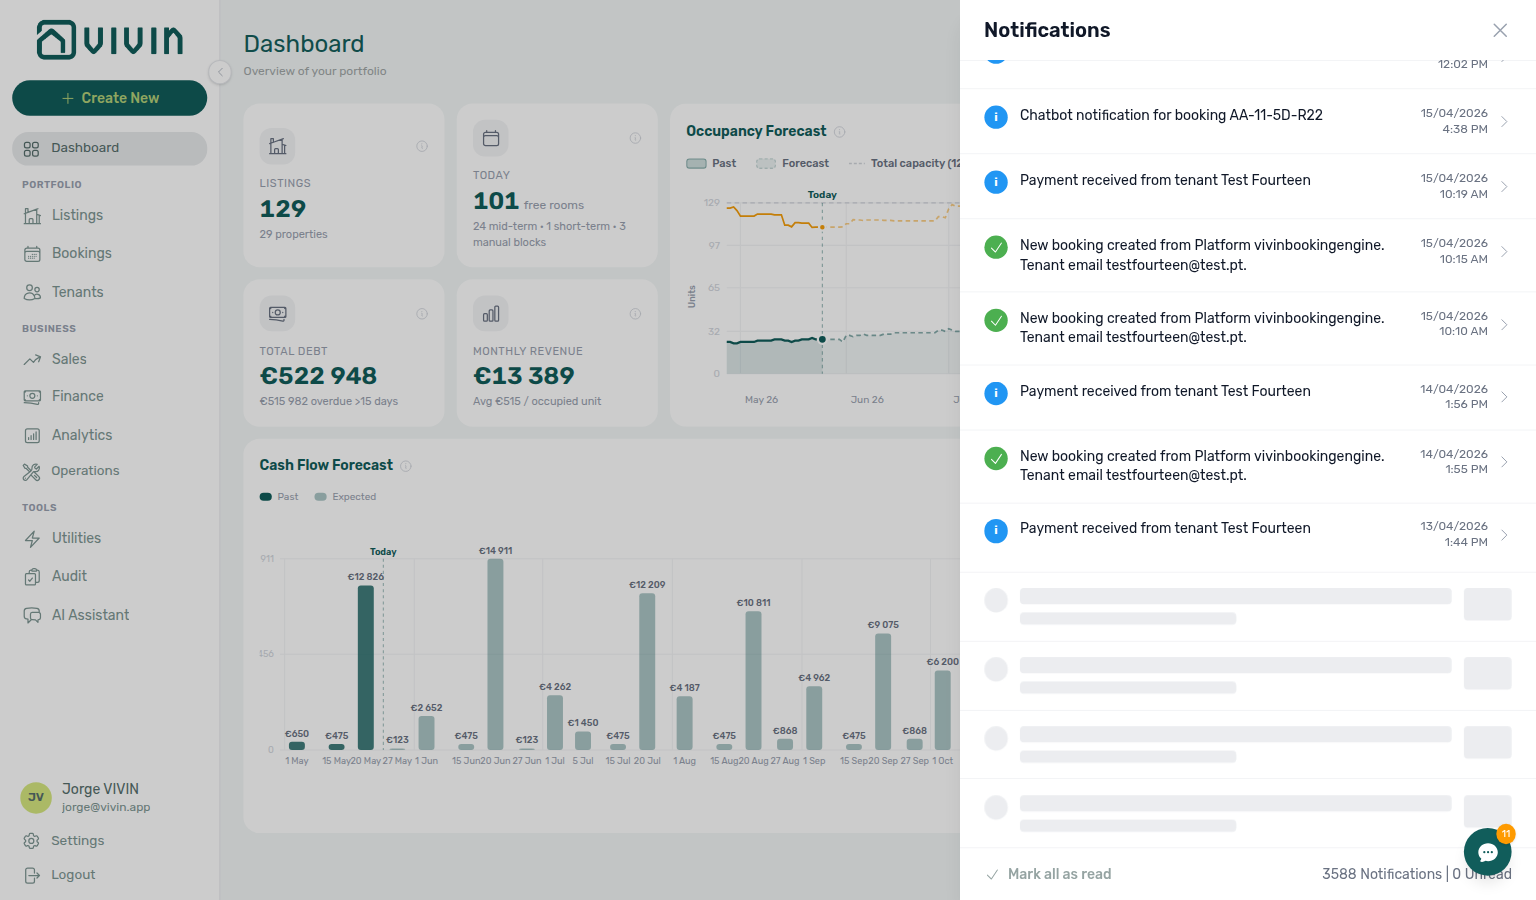
On desktop widths, the page header includes a bell that opens a Notifications slide-over with General and Inbox sub-tabs when the WhatsApp global inbox release is active (#1812). General covers payment, ticket, and booking alerts; Inbox covers inbound WhatsApp and email message notifications (coalesced per conversation). Each sub-tab shows its own unread badge; Mark all as read clears only the active tab. Inbox rows with a link navigate straight to the conversation; General rows without a link open in-panel Notification detail (sub-tabs hide until you tap the header back arrow). Scroll the panel list to load additional history; while the next batch loads, skeleton rows appear at the bottom. See Inbox module and the Notifications module capture. Use /notifications for search, read-status filters, and the End of list marker on the full history page.
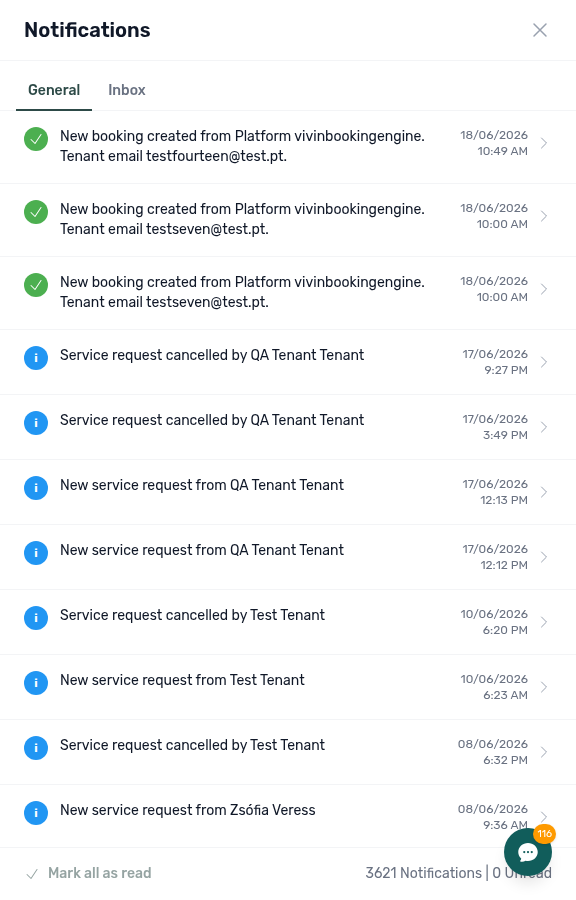
Inbox sub-tab (inbound WhatsApp / email message notifications — coalesced per conversation):
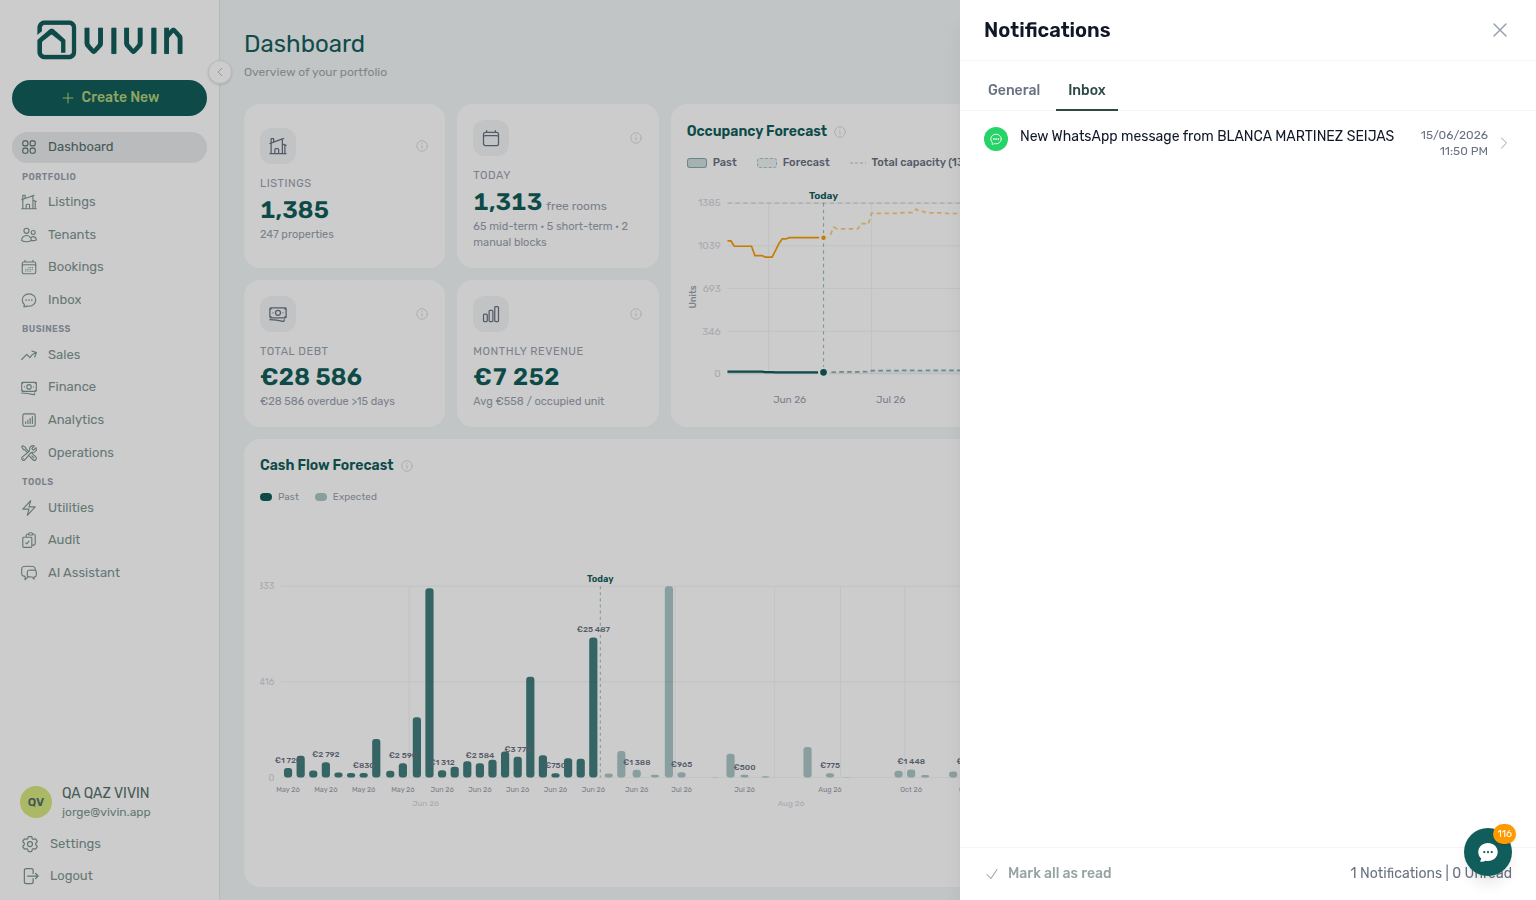
When you scroll near the bottom of that panel, the next batch loads with skeleton rows at the end of the list (no End of list line on Dashboard):
Recommended daily operator flow
This scan order mirrors Portfolio KPI review and Notification triage — open the full pairing matrix when one widget disagrees with Analytics or Finance. Full pairing matrix: Dashboard section cross-reference.
- Scan KPI cards for debt and revenue deviations.
- Check Occupancy Forecast for capacity risk in upcoming weeks/months.
- Review Cash Flow Forecast for expected inflow timing.
- Work through Vacant Units to target leasing actions.
Dashboard guide subsection index
This index pairs Dashboard widget sections and Related subsections — use it when one KPI disagrees with Analytics, Finance, or Sales. Full pairing matrix: Dashboard section cross-reference.
Dashboard section cross-reference
Use this table when one Dashboard widget or panel naturally leads into another module, workflow, or concept — each row links to the docs you should read before or after acting on that snapshot.
Related
Related below links this module to settings, concepts, workflows, and escalation paths. Pair Documentation map & escalation with Modules hub — Documentation map & escalation; pair Upstream & downstream workflows with Common Workflows — Workflow cross-reference. Topic-to-section pairing in sections above: Dashboard guide subsection index · Dashboard section cross-reference. Full hub matrix: Module cross-reference · Modules hub subsection index.
Documentation map & escalation
Documentation-map bullets pair with Introduction — Section cross-reference and FAQ — Section cross-reference. Hub parity: Modules hub — Documentation map & escalation. Full pairing matrix: Dashboard section cross-reference · Module cross-reference.
- Modules hub — Hub pairing matrix across operator workspaces
- Getting Started — Post-login shell before you rely on KPI cards
- Glossary — Term definitions used across Dashboard follow-up (debt, deposits, invoiced floor)
- FAQ — Analytics (KPI workspace) — When Dashboard cards disagree with Analytics charts
- Get Help & Support — Escalate when partial-load banners persist after Retry
Upstream & downstream workflows
Workflow bullets pair with Common Workflows — Workflow cross-reference. Full pairing matrix: Dashboard section cross-reference · Module cross-reference.
- Portfolio KPI review (section cross-reference; Deeper workflow reads; hub) — Month-end reconciliation between Dashboard cards and Analytics/Sales
- Handling a Late Payment (section cross-reference; Deeper workflow reads; hub) — Collections workflow from Total Debt or overdue signals
- Processing a New Booking (section cross-reference; Deeper workflow reads; hub) — New reservations that shift Total debt and move-in KPIs on this snapshot
- Managing a Check-out & Deposit Refund (section cross-reference; Deeper workflow reads; hub) — Deposit and debt KPIs during departure week
- Cancelling a Booking (section cross-reference; Deeper workflow reads; hub) — When Total Debt or move-in KPIs point to reservations that should be voided instead of chased
- Entering Monthly Utility Bills (section cross-reference; Deeper workflow reads; hub) — Close Missing bill gaps when Vacant Units or operational KPIs need utility context
- Notification triage (section cross-reference; Deeper workflow reads; hub) — Dashboard bell slide-over vs full
/notificationsinbox - Notifications — Payment overdue alerts — Operator Payments category rows from the bell or
/notificationsthat row-click into Bookings - Manual block hygiene (section cross-reference; Deeper workflow reads; hub) — Audit pass when Vacant Units or Today counts look lower than Sales or Analytics suggest
Deeper workflow reads
Workflow reads pair with Common Workflows hub subsection index and Workflow cross-reference. Each workflow sub-guide reciprocates with [Deeper workflow reads](../modules/dashboard/index.md#deeper-workflow-reads) anchors on Module documentation hubs bullets — hub parity: Modules hub — Deeper workflow reads. Full pairing matrix: Dashboard section cross-reference · Module cross-reference.
- Portfolio KPI review — Reconcile Total debt, Today, and forecast widgets with Analytics month-range charts (section cross-reference; Deeper API reads; hub)
- Handling a Late Payment — Collections when Total Debt KPI or overdue bell rows need Finance → Transactions follow-up (section cross-reference; Deeper API reads; hub)
- Processing a New Booking — New reservations that shift Total debt and move-in KPIs on this snapshot (section cross-reference; Deeper API reads; hub)
- Managing a Check-out & Deposit Refund — Deposit and debt KPIs during departure week (section cross-reference; Deeper API reads; hub)
- Cancelling a Booking — When Total Debt or move-in KPIs point to reservations that should be voided instead of chased (section cross-reference; Deeper API reads; hub)
- Entering Monthly Utility Bills — Close Missing bill gaps when Vacant Units or operational KPIs need utility context (section cross-reference; Deeper API reads; hub)
- Notification triage — Dashboard bell slide-over vs full
/notificationsinbox (section cross-reference; Deeper API reads; hub) - Manual block hygiene — Audit pass when Vacant Units or Today counts look lower than Sales or Analytics suggest (section cross-reference; Deeper API reads; hub)
Navigation & bookmarks
Bookmark routes pair with Management Frontend Deep Links and Create New menu. Full pairing matrix: Dashboard section cross-reference · Module cross-reference.
- Management Frontend Deep Links — Dashboard — Bookmark
/and notification bell behaviour - Create New menu — Global + shortcuts without leaving the post-login snapshot
- FAQ — Permission denied toast — Red You do not have permission to perform this action. toast when RBAC blocks a save; fix in Users → Role Permissions
- Settings > Interface language — Personal UI locale and per-user notification opt-outs
Settings that shape Dashboard KPIs
Settings bullets pair with Account Settings — Tab cross-reference. Full pairing matrix: Dashboard section cross-reference · Module cross-reference.
- Settings > Preferences — In-app notifications — Mute Dashboard bell categories account-wide before personal opt-out
- Settings > Preferences — Account toggles that shape move-in auto-cancel and debt KPI signals
- Settings > Tenant categories — Segment portal adoption checks when Total debt KPI follow-up needs online-payment context
- Settings > Emails — Payment reminder Communication Rules whose outcomes surface as Dashboard KPI and bell alerts
Deeper concept reads
Concept reads pair with Concepts hub subsection index and Concept cross-reference. Full pairing matrix: Dashboard section cross-reference · Module cross-reference.
- Payment Allocation — Two-layer receipts, invoiced-floor rent edits, and credit note reject/revert warnings (section cross-reference; hub)
- Booking Lifecycle — Computed Upcoming → Ongoing → Ended / Canceled status model behind occupancy KPIs (section cross-reference; hub)
- Integrations & Distribution — Unified snapshot across mid-term marketplace and short-term channel bookings (section cross-reference; hub)
- Tenant Portal — Total debt KPI follow-up when tenants pay online through the portal (section cross-reference; hub)
- FAQ — Tenant contract signing blocked — No PDF yet, mandatory Your Details gates, category locks, or Lease purpose; portal signing vs paper upload on Contract Info
- Services Marketplace — Ancillary portal revenue that can shift Total debt and Income KPIs after service requests post (section cross-reference; hub)
- Landlord MCP — External portfolio tools that may return the same KPI snapshots before you open Finance drill-downs (section cross-reference; hub)
Operator modules (pairing surfaces)
Module hub bullets pair with Modules — Module cross-reference. Full pairing matrix: Dashboard section cross-reference · Module cross-reference.
- Analytics Module — Overview tab — Longer-range portfolio KPI bar grid when your role includes Analytics access
- Sales Module — Overview tab — Listing-centric occupancy heatmap and Today KPIs that pair with Vacant Units and Occupancy Forecast here
- Finance Module — Detailed debt, payments, and cash flow management
- Finance — Tenant category filter — In Debt triage by segment when KPI cards spike for one cohort
- Finance > Deposits — Portfolio refund queue when Dashboard KPIs surface departure-week balances
- Bookings Module — Reservation lifecycle when bell rows row-click into bookings
- Bookings — Other filters tenant category — Mirror segment filter when KPI follow-up clusters on one cohort
- Tenants — Tenant category filter — Profile-count cross-check before account-wide portal changes after KPI triage
- Listings Module — Inventory and vacancy context
- Audit Module — Cross-portfolio manual blocks and Discounts when KPI follow-up needs contract-value triage
- Inbox module — Reply to Dashboard bell Inbox rows without opening each booking Communication tab first
- Notifications module — In-app notification preferences — Full
/notificationsinbox and category behaviour behind the Dashboard bell - Utilities — Overview tab — Days Missing Data chart when bill gaps affect operational planning alongside Vacant Units
- AI Chat module — Natural-language summaries that should be reconciled against these KPI cards
- Properties workspace — Legacy
/propertiesURLs that redirect into Listings from the same shell
Lockout catch-up after password recovery
Operational backlog after sign-in recovery pairs with Resetting a Management User Password — Step 3. Hub parity: Common Workflows — Lockout catch-up after password recovery. Full pairing matrix: Dashboard section cross-reference · Module cross-reference.
- Common Workflows — Lockout catch-up after password recovery — Hub matrix when sign-in was restored and KPI cards or bell backlog accumulated during lockout
- Getting Started — Lockout catch-up after password recovery — Canonical operational backlog mesh
- Notifications bell (desktop) — Slide-over triage before Mark all as read on stale payment alerts
- Notification triage — Step 4 row-click navigation into Bookings, Finance, or Tenants
- Pending manual receipt approval — Total debt KPI may lag until Finance clears Pending receipts
Pending manual receipt approval
Receipt approval pairs with Finance — Pending manual payments and Bookings — Transactions tab. Hub parity: Common Workflows — Pending manual receipt approval. Full pairing matrix: Dashboard section cross-reference · Module cross-reference.
-
Common Workflows — Pending manual receipt approval — Hub matrix when Total debt or Manual Payments KPI cards lag until Approve payments confirms recorded transfers
-
Finance — Pending manual payments — Amber Pending chip on Finance → Transactions
-
KPI cards (top-left grid) — Total debt and collections KPIs that may not refresh until pending receipts are approved
-
Payment overdue alerts (in-app) — Operator Payments category rows that may include pending manual in-payment states
-
FAQ — Manual receipt still pending — Why Dashboard debt headline may disagree with Finance until approval
-
FAQ — Pending manual receipt approval hub — Symptom table for Approve payments / amber Pending
Notification row-click navigation
Dashboard bell General rows usually open in-panel Notification detail — row-click into Bookings, Tenants, or Listings happens on /notifications. Pair Notification triage — Step 4 before bulk Mark all as read on post-login backlog. Hub parity: Common Workflows — Notification row-click navigation. Full pairing matrix: Dashboard section cross-reference · Module cross-reference.
- Common Workflows — Notification row-click navigation — Hub matrix (
notifications-module-row-click-target.png,notifications-row-navigate-to-booking-detail.png,notifications-row-navigation-flow.mp4) - Notifications bell (desktop) — Slide-over vs full
/notificationsinbox - Notifications module — Notification row-click navigation — Canonical module pairing
- Bookings — Notification row-click navigation — Booking sidebar landing zone after row-click
- Tenants — Notification row-click navigation — Tenant profile sidebar when alert carries
tenantId - Inbox — Notification row-click navigation — Bell Inbox
linkdeep-link vs General row-click - Operations — Notification row-click navigation — Turnover-week alerts that row-click into Bookings first
- Listings — Notification row-click navigation — Property or unit sidebar when alert carries
listingIdorpropertyId - Utilities — Notification row-click navigation — Overage payment overdue alerts after bill cycle
- Sales — Notification row-click navigation — Channel-import alerts before Multicalendar review
- Analytics — Notification row-click navigation — Month-range KPI charts after row-click opens booking context
- AI Chat — Notification row-click navigation — Verify assistant-cited alerts by row-click before operational follow-up
- Audit — Notification row-click navigation — Discounts / Manual Blocks month-end review after row-click
- Legacy
/propertiesURLs — Notification row-click navigation — Legacy bookmarks that land in Listings during alert triage - Booking engine details — Notification row-click navigation — Engine-sourced alerts before Full integration payload edits
- Finance — Notification row-click navigation — Overview / Transactions after row-click lands on booking
- Notification triage — Step 4 — Row-click before Step 5
- Payment alert to receivables triage — Ongoing/Ended payment overdue row-click
- Confirmation alert triage — Upcoming Booking created / Payment received row-click
- KPI cards (top-left grid) — Reconcile Total Debt after row-click opens booking Transactions
- Portfolio KPI review — Notification row-click navigation — Month-end alert batch on Step 7
- Handling a Late Payment — Notification row-click navigation — payment overdue on Step 1 after alert row-click
- Processing a New Booking — Notification row-click navigation — Booking created / Payment received on Step 6
- Lockout catch-up after password recovery — Bell backlog after sign-in restored
- FAQ — Notification row-click navigation — Target field order (
link,bookingId,tenantId,listingId,propertyId)
Payment alert to receivables triage
Ongoing/Ended payment overdue alerts on /notifications row-click into Bookings before you trust Total Debt on KPI cards (top-left grid) or open Finance → Overview → Debt Aging. Hub parity: Common Workflows — Payment alert to receivables triage. Full pairing matrix: Dashboard section cross-reference · Module cross-reference.
- Common Workflows — Payment alert to receivables triage — Hub matrix (
notifications-row-navigate-to-booking-detail.png,notifications-row-navigation-flow.mp4,finance-overview-debt-aging-walkthrough-flow.mp4) - Notifications — Payment overdue alerts (in-app) — Payments category operator rows
- Bookings — Payment alert to receivables triage — Payment Plan / Transactions on opened booking
- Tenants — Payment alert to receivables triage — With Debt cross-check on tenant profile
- Inbox — Payment alert to receivables triage — payment overdue on General before WhatsApp chase
- Operations — Payment alert to receivables triage — Unpaid move-in lines before key handover on Check-in & Check-out
- Listings — Payment alert to receivables triage — Property Payments Active portal charges on listing bookings
- Utilities — Payment alert to receivables triage — Utility overage lines behind overdue alerts
- Sales — Payment alert to receivables triage — Channel-import schedules behind overdue alerts
- Analytics — Payment alert to receivables triage — Revenue trend may lag until receivables clear
- AI Chat — Payment alert to receivables triage — Validate assistant debt answers after receivables triage
- Audit — Payment alert to receivables triage — Discounts review when receivables lag behind goodwill lines
- Legacy
/propertiesURLs — Payment alert to receivables triage — Collections on bookings tied to redirected properties - Booking engine details — Payment alert to receivables triage — Engine-sourced schedules behind overdue alerts
- Notification row-click navigation — Row-click on
/notificationsbefore portfolio KPI read - Finance — Payment alert to receivables triage — Top debtors when alert batch needs rank
- Finance — Finance debt receivables triage — Debt Aging panel after single-booking triage
- KPI cards (top-left grid) — Total Debt headline vs opened booking balance
- Portfolio KPI review — Dashboard Total Debt subtitle — Month-end reconciliation habit
- Pending manual receipt approval — Amber Pending before Debt Aging sign-off
- Confirmation alert triage — Contrast Upcoming vs Ongoing/Ended alerts
- Handling a Late Payment — Payment alert to receivables triage — payment overdue on Step 1 after alert row-click
- Portfolio KPI review — Payment alert to receivables triage — Month-end alert batch on Step 7
- Notification triage — Payment alert to receivables triage — Payments row-click on Step 4
- FAQ — Payment alert to receivables triage — Alert-type contrast table
- FAQ — Payment alert to receivables triage hub — Total Debt KPI after alert row-click symptom table
Finance debt receivables triage
Total Debt on KPI cards (top-left grid) is headline-only — open Finance → Overview → Debt Aging when receivables stay high after Payment alert to receivables triage. Pair Finance Income status drill-down and Cash flow forecast drill-down when Income segments or collections history disagree with the post-login headline. Hub parity: Common Workflows — Finance debt receivables triage. Full pairing matrix: Dashboard section cross-reference · Module cross-reference.
- Common Workflows — Finance debt receivables triage — Hub matrix when Dashboard Total Debt, Debt Aging, and Income → In debt disagree (
finance-overview-income-chart-debt-aging.png,finance-overview-debt-aging-walkthrough-flow.mp4) - Payment alert to receivables triage — Single-booking alert triage before portfolio surfaces
- Finance Income status drill-down — Income chart segments vs Total Debt headline (
dashboard-kpi-total-debt-tooltip.png) - Cash flow forecast drill-down — Finance collections history vs Cash Flow Forecast rent due timing
- Finance — Finance debt receivables triage — Debt Aging Top debtors canonical surface
- Pending manual receipt approval — Clear amber Pending before Top debtors sign-off
- Dashboard — Finance debt receivables triage — Total Debt headline vs Finance drill-down
- Bookings — Finance debt receivables triage — Payment Plan on opened booking
- Handling a Late Payment — Finance debt receivables triage — Debt Aging on Step 1 before outreach
- Portfolio KPI review — Finance debt receivables triage — Month-end Top debtors on Step 7
- FAQ — Finance debt receivables triage hub — Symptom table for four-surface triage
- KPI cards (top-left grid) — Total Debt headline vs Finance Top debtors (
dashboard-kpi-total-debt-tooltip.png) - Portfolio KPI review — Dashboard Total Debt subtitle — Month-end reconciliation habit
Finance Income status drill-down
Post-login Total Debt headline is not the Income chart — open Finance → Overview for Paid / Scheduled / In debt segment drill-down. Hub parity: Common Workflows — Finance Income status drill-down. Full pairing matrix: Dashboard section cross-reference · Module cross-reference.
- Common Workflows — Finance Income status drill-down — Hub matrix (
finance-overview-income-status-in-debt-modal.png,finance-overview-income-drill-down-flow.mp4) - Finance debt receivables triage — Debt Aging Top debtors when payment-line modal is not enough
- Finance — Income status drill-down — Stacked Income chart canonical surface
- FAQ — Finance Income status drill-down hub — Symptom table for segment vs Debt Aging
- FAQ — Finance Income status drill-down — Paid / Scheduled / In debt segment-click habit
- Portfolio KPI review — Finance Income status drill-down — Month-end Income reconciliation on Step 7
- KPI cards (top-left grid) — Total Debt headline vs Income segments (
dashboard-kpi-total-debt-tooltip.png) - Finance debt receivables triage — Four-surface habit after segment read
Cash flow forecast drill-down
Post-login Dashboard Cash Flow Forecast shows rent due timing — open Finance → Overview Cash flow forecast for confirmed collections history. Hub parity: Common Workflows — Cash flow forecast drill-down. Full pairing matrix: Dashboard section cross-reference · Module cross-reference.
- Common Workflows — Cash flow forecast drill-down — Hub matrix (
finance-overview-cash-flow-all-payments-modal.png,finance-overview-cash-flow-day-view.png,finance-overview-cash-flow-drill-down-flow.mp4) - Finance Income status drill-down — Paid / Scheduled / In debt segments — not collections history
- Finance — Income chart and cash flow forecast — Canonical Cash flow forecast chart surface
- FAQ — Cash flow forecast drill-down hub — Symptom table for collections vs Income / Dashboard
- FAQ — Cash flow forecast drill-down — Month / Day bar-click habit
- Portfolio KPI review — Cash flow forecast drill-down — Month-end collections reconciliation on Step 7
- Cash Flow Forecast — Rent due chart on
/(dashboard-cash-flow-forecast-chart.png) — not Finance collections - KPI cards (top-left grid) — Total Debt headline vs Cash flow forecast month bars
Confirmation alert triage
Upcoming Booking created / Payment received / Pending manual in-payment rows on /notifications row-click into Bookings — finish Processing a New Booking — Step 5b / Step 6 before bulk-clear on post-login bell backlog. Hub parity: Common Workflows — Confirmation alert triage. Full pairing matrix: Dashboard section cross-reference · Module cross-reference.
- Common Workflows — Confirmation alert triage — Hub matrix (
notifications-row-navigate-to-booking-detail.png,notifications-row-navigation-flow.mp4) - Notifications module — Confirmation alert triage — Canonical module pairing
- Bookings — Confirmation alert triage — Transactions / Contract Info on Upcoming imports
- Tenants — Confirmation alert triage — Tenant Info / Category on confirmation-week clusters
- Finance — Confirmation alert triage — Transactions amber Pending before Overview KPI refresh
- Inbox — Confirmation alert triage — WhatsApp thread after Payment received row-click
- Operations — Confirmation alert triage — Turnover prep after confirmation receipts approved
- Listings — Confirmation alert triage — Channel import bookings on go-live properties
- Utilities — Confirmation alert triage — First bill cycle after go-live alerts
- Sales — Confirmation alert triage — Channel-import Upcoming alerts before Channels linking
- Analytics — Confirmation alert triage — Upcoming alerts during month-end KPI review
- AI Chat — Confirmation alert triage — Assistant-cited confirmation backlog before bulk mark-read
- Audit — Confirmation alert triage — Month-end Discounts review after confirmation receipts approved
- Legacy
/propertiesURLs — Confirmation alert triage — First alerts after legacy redirects land in Listings - Booking engine details — Confirmation alert triage — White-label Upcoming alerts before payload sync
- Notification row-click navigation — Row-click on
/notificationsbefore mark-read - Payment alert to receivables triage — Contrast Upcoming vs Ongoing/Ended payment overdue
- Pending manual receipt approval — Payment received alert until Approve payments
- Processing a New Booking — Step 5b / Step 6 — Canonical confirmation gates
- Notification triage — Confirmation alert triage — Steps 4 / 5 path
- Portfolio KPI review — Confirmation alert triage — Month-end alert cleanup on Step 7
- Onboarding a New Property — Confirmation alert triage — First confirmation alerts on go-live (Step 7)
- FAQ — Confirmation alert triage — Alert-type table and bulk mark-read guard
- FAQ — Confirmation alert triage hub — Post-login Upcoming alert backlog on bell symptom table
New inventory to first booking handoff
Post-login scan on go-live accounts should clear first Booking created bell backlog — pair Onboarding — Step 7 with Processing a New Booking — Steps 1–6 before arrival-week planning. Hub parity: Common Workflows — New inventory to first booking handoff. Full pairing matrix: Dashboard section cross-reference · Module cross-reference.
- Notifications — New inventory to first booking handoff — First Booking created bell backlog
- Bookings — New inventory to first booking handoff — First Upcoming status tabs
- Onboarding a New Property — Step 7 — Upstream go-live verify
- Processing a New Booking — Step 1 — Duplicate check on first import
- Common Workflows — New inventory to first booking handoff — Hub matrix (
bookings-add-booking-modal.png,workflows-onboarding-property-wizard.mp4) - Confirmation alert triage — Upcoming alert row-click
- Property setup to first arrival handoff — Downstream arrival-week scan
- FAQ — New inventory to first booking handoff — Symptom table for property wizard → first reservation
Property setup to first arrival handoff
Post-login scan on go-live accounts should include Operations → Check-in & Check-out Next 7 days when the first Upcoming reservation approaches move-in — after Onboarding a New Property — Step 7. Hub parity: Common Workflows — Property setup to first arrival handoff. Full pairing matrix: Dashboard section cross-reference · Module cross-reference.
- Operations — Property setup to first arrival handoff — Check-in & Check-out first-arrival week lists
- Notifications — Property setup to first arrival handoff — Arrival/access alerts on first move-in
- Bookings — Property setup to first arrival handoff — First Upcoming status tabs
- Onboarding a New Property — Step 7 — Upstream go-live verify
- Managing a Check-in — Step 1 — Downstream arrival-week entry
- Common Workflows — Property setup to first arrival handoff — Hub matrix (
workflows-operations-check-in-out-planning-view.png,workflows-onboarding-property-wizard.mp4) - Confirmation to check-in handoff — Upstream Upcoming portal gates
- FAQ — Property setup to first arrival handoff — Symptom table for go-live → first arrival week
Confirmation to check-in handoff
Upcoming reservations finish Processing a New Booking — Step 6 portal gates before arrival-week planning on Operations — Check-in & Check-out (~7 days out). Hub parity: Common Workflows — Confirmation to check-in handoff. Full pairing matrix: Dashboard section cross-reference · Module cross-reference.
- Notifications bell (desktop) — Upcoming alert backlog before arrival-week scan
- Confirmation alert triage — Booking created / Payment received row-click before Step 6
- Bookings — Confirmation to check-in handoff — Contract Info portal gates on Upcoming imports
- Operations — Confirmation to check-in handoff — Next 7 days Check-ins pill after confirmation closes
- Common Workflows — Confirmation to check-in handoff — Hub matrix (
bookings-detail-contract-method-of-payments.png,workflows-operations-check-in-out-planning-view.png,booking-lifecycle-status-tabs-flow.mp4) - Processing a New Booking — Step 6 — Upstream portal sanity before handoff
- Managing a Check-in — Step 1 — Downstream arrival-week entry (~7 days out)
- Pending manual receipt approval — Step 5b confirmation receipts before handoff
- FAQ — Confirmation to check-in handoff — Symptom table for Upcoming → arrival week
Check-in to check-out handoff
Post-login scan should include Ongoing stays entering departure week on Operations — Check-in & Check-out — not only Upcoming arrival backlog from Confirmation to check-in handoff. Hub parity: Common Workflows — Check-in to check-out handoff. Full pairing matrix: dashboard-section-cross-reference · Module cross-reference.
- Notifications bell (desktop) — payment overdue on Ongoing stays during departure week
- Operations — Check-in to check-out handoff — Check-outs pill on post-login scan
- Bookings — Check-in to check-out handoff — Timeline departure bars
- Managing a Check-in — Step 4 — Upstream keys handed over
- Managing a Check-out — Step 1 — Downstream departure-week entry
- Common Workflows — Check-in to check-out handoff — Hub matrix (
operations-check-in-out-check-outs-next-7-days.png,bookings-timeline-view.png) - Confirmation to check-in handoff — Upcoming → arrival week contrast
- FAQ — Check-in to check-out handoff — Symptom table for Ongoing → departure week
Check-out final utilities handoff
Post-login KPI cards (top-left grid) scan should include departure-week utility overage arrears after final bill posting — pair with Utilities Missing toggle before Deposit refund planning. Hub parity: Common Workflows — Check-out final utilities handoff. Distinct from Check-out collections before refund (rent/fee arrears). Full pairing matrix: dashboard-section-cross-reference · Module cross-reference.
- KPI cards (top-left grid) — Departure-week utility overage in post-login Total Debt KPI
- Notifications bell (desktop) — Utility payment overdue during departure week
- Utilities — Check-out final utilities handoff — Missing bills upstream of KPI spike
- Finance — Check-out final utilities handoff — Contract Values drill-down after bell triage
- Entering Monthly Utility Bills — Step 4 — Upstream overage posting verification
- Managing a Check-out — Step 6 — Settlement before deposit release
- Common Workflows — Check-out final utilities handoff — Hub matrix (
dashboard-total-debt-subtitle.png,utilities-allocations-review-flow.mp4) - FAQ — Check-out final utilities handoff — Symptom table for final utility overage blocking refund
Same-day turnover coordination
Post-login scan on high-churn units should include hub Common Workflows — Same-day turnover coordination — pair Notifications bell turnover-week alerts with Operations → Check-in & Check-out before incoming key handover. Full pairing matrix: dashboard-section-cross-reference · Module cross-reference.
- Common Workflows — Same-day turnover coordination — Hub matrix (
operations-check-in-out-check-outs-next-7-days.png,bookings-timeline-day-week-month-and-sidebar.mp4) - Notifications bell (desktop) — Arrival/access alerts on turnover week
- KPI cards (top-left grid) — Total Debt from outgoing stay before incoming handover
- Operations — Same-day turnover coordination — Check-outs / Check-ins pills after bell triage
- Bookings — Same-day turnover coordination — Timeline Week scale overlap
- Notification triage — Same-day turnover coordination — Arrival/access alerts on turnover week via Step 4
- Managing a Check-out — Step 2 — Turnover ticket before incoming arrival
- FAQ — Same-day turnovers — Four-step operator habit
- Glossary — Same-day turnover — Shared-unit vocabulary
WhatsApp per-booking messaging
Bell Inbox sub-tab New WhatsApp message from … pings pair with Bookings → Communication when operators need Payment Plan context — contrast bell General payment alerts. Hub parity: Glossary — WhatsApp per-booking messaging hub · Common Workflows — WhatsApp per-booking messaging. Full pairing matrix: Dashboard section cross-reference · Module cross-reference.
- Common Workflows — WhatsApp per-booking messaging — Hub matrix (
bookings-detail-communication-tab-whatsapp-thread.png,inbox-module-overview.png,inbox-module-triage-flow.mp4) - Glossary — WhatsApp per-booking messaging hub — Surface table + per-guide/module mesh reciprocal hub
- Notifications — WhatsApp per-booking messaging — Canonical
/notificationsmessage alert rows - Bookings — WhatsApp per-booking messaging — Communication tab composer with Payment Plan context
- Inbox — WhatsApp per-booking messaging — Cross-booking triage and bell Inbox sub-tab
- Tenants — WhatsApp per-booking messaging — Tenant profile after Inbox name click
- Finance — WhatsApp per-booking messaging — Collections outreach with Transactions visible
- Operations — WhatsApp per-booking messaging — Maintenance ticket threads on Communication
- Listings — WhatsApp per-booking messaging — Go-live property tenant threads after channel import
- Utilities — WhatsApp per-booking messaging — Utility overage bill questions on Communication
- Sales — WhatsApp per-booking messaging — Channel-import message backlog during Multicalendar review
- Analytics — WhatsApp per-booking messaging — Month-end message backlog during KPI review
- AI Chat — WhatsApp per-booking messaging — Assistant-cited threads before operational follow-up
- Audit — WhatsApp per-booking messaging — Month-end communication review after Discounts audit
- Legacy
/propertiesURLs — WhatsApp per-booking messaging — Legacy bookmarks during message triage - Booking engine details — WhatsApp per-booking messaging — Engine-sourced tenant threads before payload sync
- Notifications bell (desktop) — Bell Inbox vs General sub-tabs
- Notification row-click navigation — Message alerts on
/notificationsvs bell Inbox - Common Workflows — Notification row-click navigation —
New WhatsApp message from …on/notificationsvs bell Inbox - Notification triage — WhatsApp per-booking messaging — Message pings on bell Inbox /
/notifications - Handling a Late Payment — WhatsApp per-booking messaging — Collections outreach on Step 3
- Managing a Check-in — WhatsApp per-booking messaging — Arrival-week threads before Step 4
- Managing a Check-out — WhatsApp per-booking messaging — Departure settlement on Step 6
- Processing a New Booking — WhatsApp per-booking messaging — Confirmation follow-up on Step 6
- Cancelling a Booking — WhatsApp per-booking messaging — Void outreach before Step 4
- Entering Monthly Utility Bills — WhatsApp per-booking messaging — Overage bill questions on Step 4
- Portfolio KPI review — WhatsApp per-booking messaging — Month-end message backlog on Step 7
- Manual block hygiene — WhatsApp per-booking messaging — Blocked-date questions on Step 3
- Onboarding a New Property — WhatsApp per-booking messaging — First tenant threads on Step 7 go-live
- Using in-app support — WhatsApp per-booking messaging — Self-serve Inbox / Communication before filing
- Resetting a Management User Password — WhatsApp per-booking messaging — Lockout-delayed bell Inbox after Step 3
- FAQ — WhatsApp per-booking messaging hub — Post-login
New WhatsApp message from …on bell Inbox vs General symptom table
Bot reasoning (audit)
Bell Inbox bot pings vs General payment alerts. Hub parity: Glossary — Bot reasoning (audit) hub · Common Workflows — Bot reasoning (audit). Full pairing matrix: Dashboard section cross-reference · Module cross-reference.
- Common Workflows — Bot reasoning (audit) — Hub matrix (
bookings-detail-communication-tab-bot-reasoning-expanded.png) - Glossary — Bot reasoning (audit) hub — Surface table + per-guide/module mesh reciprocal hub
- Bookings — Bot reasoning (audit) — Canonical Communication Reasoning control
- ChatBot settings — Read-only audit vs editable persona / IF/THEN
ChatBot settings
Account Settings → ChatBot pairs with Communication thread review — bell inbox bot pings vs general payment alerts. Hub parity: Glossary — ChatBot settings hub · Common Workflows — ChatBot settings. Full pairing matrix: Dashboard section cross-reference · Module cross-reference.
- Common Workflows — ChatBot settings — Hub matrix (
settings-chatbot-tab-overview.png,settings-chatbot-status-bot-connected.png,settings-chatbot-save-rule-flow.mp4) - Glossary — ChatBot settings hub — Surface table + per-guide/module mesh reciprocal hub
- ChatBot settings — Persona, IF/THEN rules, Status Bot pairing
- Glossary — Bot reasoning (audit) hub — Thread audit after rule changes
Rent reduction after invoicing
Total Debt KPI follow-up may surface bookings where month-end repricing is blocked by exported rent — open Bookings → Contract Info → Change monthly rent before trusting headline debt. Pair Bulk Hostkit invoicing when external relief surfaces Not issued credit note rows. Hub parity: Common Workflows — Rent reduction after invoicing. Full pairing matrix: Dashboard section cross-reference · Module cross-reference.
- Common Workflows — Rent reduction after invoicing — Hub matrix (
bookings-detail-change-monthly-rent-modal.png,bookings-rent-reduction-invoiced-floor-flow.mp4) - Bookings — Changing contract dates and rent — Contract Info repricing entry point
- Bookings — Contract Values tab — Per-line Edit amount under the same floor
- Finance — Invoiced floor and rent edits — Why edits start on the booking, not Finance → Transactions
- KPI cards (top-left grid) — Total debt after repricing on opened booking
- Processing a New Booking — Rent reduction after invoicing — Confirmation month already invoiced on Step 3
- Handling a Late Payment — Rent reduction after invoicing — Collections goodwill after Step 4
- Portfolio KPI review — Rent reduction after invoicing — Month-end repricing sign-off on Step 7
- Cancelling a Booking — Rent reduction after invoicing — Settlement repricing during Step 2b
- Managing a Check-in — Rent reduction after invoicing — Pre-move-in goodwill
- Managing a Check-out — Rent reduction after invoicing — Departure-week goodwill adjustments
- Notification triage — Rent reduction after invoicing — Row-click to invoiced booking on Step 4
- Entering Monthly Utility Bills — Rent reduction after invoicing — Month-end bill cycle on Step 5
- Manual block hygiene — Rent reduction after invoicing — Hold cleanup on Step 5
- Using in-app support — Rent reduction after invoicing — Self-serve before filing tickets
- Resetting a Management User Password — Rent reduction after invoicing — Lockout-delayed repricing after Step 3
- FAQ — Rent reduction after invoicing hub — Post-login Total Debt triage surfacing invoiced-floor repricing symptom table
Reject/revert mistaken receipts
Receipt cleanup pairs with Finance — Row actions on in-payment rows and Bookings — Row actions on in-payment rows. Hub parity: Common Workflows — Reject/revert mistaken receipts. Full pairing matrix: Dashboard section cross-reference · Module cross-reference.
-
Common Workflows — Reject/revert mistaken receipts — Hub matrix when duplicate receipts inflated Total debt before cleanup on Finance Transactions
-
Finance — Row actions on in-payment rows — Bulk Reject selected after Dashboard debt triage
-
Payment Allocation — Correcting mistaken receipts — Two-layer model before trusting KPI cards again
-
KPI cards (top-left grid) — Re-check Total debt after reject/revert changes ledger totals
-
Portfolio KPI review — Step 7 — Month-end reconciliation when Dashboard and Finance disagree after receipt cleanup
-
FAQ — Reject/revert mistaken receipts hub — Symptom table for Reject / Revert / Issue credit notes
Check-out ledger cleanup before refund
Duplicate-transfer cleanup pairs with Reject/revert mistaken receipts and Managing a Check-out. Hub parity: Common Workflows — Check-out ledger cleanup before refund. Full pairing matrix: Dashboard section cross-reference · Module cross-reference.
-
Common Workflows — Check-out ledger cleanup before refund — Hub matrix when Total debt KPI stays high after tenant paid — duplicate transfer on ledger
-
Reject/revert mistaken receipts — Reject / Revert duplicate before Ready To Refund
-
Managing a Check-out — Step 6 — Canonical departure-week duplicate cleanup before refund
-
Common Workflows — Check-out collections before refund — Real arrears contrast (tenant did not pay)
-
KPI cards (top-left grid) — Re-check Total debt after Revert on duplicates
-
Managing a Check-out — Step 6 — Canonical departure-week cleanup before refund
-
FAQ — Check-out ledger cleanup before refund hub — Symptom table for phantom In Debt / Ready To Refund blocked when tenant paid once
Utility overage collections
Utility overage arrears inflate Total debt KPI cards after monthly bill posting — triage on Finance before outreach. Hub parity: Common Workflows — Utility overage collections. Full pairing matrix: Dashboard section cross-reference · Module cross-reference.
-
Common Workflows — Utility overage collections — Hub matrix when Total debt includes utility overage In Debt after bill cycle
-
KPI cards (top-left grid) — Total debt includes overage arrears after Step 4
-
Finance — Contract Values tab — In Debt drill-down after Dashboard KPI triage
-
Handling a Late Payment — Step 1 — Collections after overage posts
-
Portfolio KPI review — Step 7 — Month-end overage arrears sign-off
-
FAQ — Utility overage collections hub — Symptom table for unpaid utility overage on Payment Plan after bill posting
Cancellation collections before void
Pre-cancel arrears pair with Cancelling a Booking and Handling a Late Payment. Hub parity: Common Workflows — Cancellation collections before void. Full pairing matrix: Dashboard section cross-reference · Module cross-reference.
-
Common Workflows — Cancellation collections before void — Hub matrix when Total debt KPI includes pre-cancel arrears blocking policy void queue
-
KPI cards (top-left grid) — Total debt before voiding bookings with unpaid Payment Plan lines
-
Cancelling a Booking — Step 2 — Settle before Step 4
-
Handling a Late Payment — Step 1 — Collections after KPI triage
-
Common Workflows — Check-out collections before refund — Departure-week mesh contrast
-
Finance — Contract Values tab — In Debt drill-down from dashboard debt KPI
-
FAQ — Cancellation collections before void hub — Symptom table for In Debt blocking Cancel booking until Payment Plan settles
Check-out collections before refund
Departure-week arrears pair with Managing a Check-out and Handling a Late Payment after Total debt KPI triage. Hub parity: Common Workflows — Check-out collections before refund. Full pairing matrix: Dashboard section cross-reference · Module cross-reference.
-
Common Workflows — Check-out collections before refund — Hub matrix when Total debt KPI includes departure-week rent arrears blocking refund queue
-
KPI cards (top-left grid) — Total debt before Ready To Refund on departure-week bookings
-
Managing a Check-out — Step 6 — Settlement after dashboard triage
-
Handling a Late Payment — Step 1 — Collections after KPI drill-down
-
Finance — Contract Values tab — In Debt filter from dashboard debt KPI
-
Common Workflows — Check-out ledger cleanup before refund — Duplicate transfer contrast (tenant paid once)
-
Common Workflows — Cancellation collections before void — Pre-cancel void contrast
-
FAQ — Check-out collections before refund hub — Symptom table for rent/fee In Debt blocking Ready To Refund before deposit release
Handling a Late Payment collections
Post-login Total debt KPI pairs with Finance → Overview → Debt Aging before Handling a Late Payment outreach — headline is not clickable. Hub parity: Common Workflows — Handling a Late Payment collections hub. Full pairing matrix: Dashboard section cross-reference · Module cross-reference.
- Common Workflows — Handling a Late Payment collections hub — Hub matrix when Total debt KPI triage needs collections Steps 1–6 (
dashboard-kpi-total-debt-tooltip.png,finance-overview-income-chart-debt-aging.png) - KPI cards (top-left grid) — Total debt headline before Finance → Overview drill-down
- Finance debt receivables triage — Debt Aging after dashboard triage
- Payment alert to receivables triage — Bell payment overdue before portfolio rank
- Finance — Finance debt receivables triage — Canonical Top debtors surface
- Handling a Late Payment — Step 1 — Collections after KPI drill-down
- Pending manual receipt approval — Pending inflates Total debt until Approve
- Common Workflows — Reject/revert mistaken receipts — Duplicate transfers inflate headline debt
- FAQ — Handling a Late Payment collections hub — Symptom table for triage surface → collections step pairing
Check-out vs cancellation
Post-login Total debt KPI does not distinguish Ended vs Canceled exits — confirm booking status on Bookings before you route to Managing a Check-out or Cancelling a Booking. Hub parity: Common Workflows — Check-out vs cancellation. Full pairing matrix: Dashboard section cross-reference · Module cross-reference.
- Common Workflows — Check-out vs cancellation — Hub matrix: Ended vs Canceled lifecycle routing (
bookings-list-canceled-tab.png,workflows-cancel-booking-refund-modal-flow.mp4) - KPI cards (top-left grid) — Total debt includes both active and recently closed stays
- Bookings — Check-out vs cancellation — Ended / Canceled filters on opened booking
- Managing a Check-out — Step 7 — Completed stay closure
- Cancelling a Booking — Step 4 — Policy void closure
- Common Workflows — Check-out collections before refund — Departure-week arrears contrast
- Common Workflows — Cancellation collections before void — Pre-cancel void contrast
- FAQ — Check-out vs cancellation — Symptom table for lifecycle exit routing
Deposit missing on Finance Deposits
Post-login Total debt KPI does not surface Finance → Deposits portfolio rows — open Finance → Deposits and clear the toolbar date range when booking Deposit tab data exists but lifecycle cards look empty. Hub parity: Common Workflows — Deposit missing on Finance Deposits. Full pairing matrix: Dashboard section cross-reference · Module cross-reference.
- Common Workflows — Deposit missing on Finance Deposits — Hub matrix when KPI triage needs deposit portfolio rows (
finance-deposits-date-range-toolbar-default.png,finance-deposits-date-range-clear-flow.mp4) - KPI cards (top-left grid) — Total debt headline before Finance → Deposits drill-down
- Finance — Deposit missing on Finance Deposits — Canonical Deposits tab toolbar Clear date range selection
- Bookings — Deposit tab — Per-booking Initial Deposit vs portfolio row
- Portfolio KPI review — Deposit missing on Finance Deposits — Month-end sign-off at Step 7
- Managing a Check-out — Deposit missing on Finance Deposits — Clear toolbar range before Step 5 refund triage
- Partly collected security deposit — Partial paid card empty until range clears
- FAQ — Deposit missing on Finance Deposits — Symptom table for toolbar date range triage
Occupancy KPI to block hygiene handoff
Vacant Units lower than Analytics → Occupancy for the same range pairs with hub Common Workflows — Occupancy KPI to block hygiene handoff before rate cuts — stale manual holds suppress available nights. Full pairing matrix: Dashboard section cross-reference · Module cross-reference.
- Common Workflows — Occupancy KPI to block hygiene handoff — Hub matrix (
dashboard-vacant-units-widget.png,analytics-kpi-occupancy-tab.png,audit-manual-blocks-filter-scroll.mp4) - Vacant Units — Live vacancy widget vs Analytics dip
- Portfolio KPI review — Step 7 — Month-end reconciliation habit
- Manual block hygiene — Downstream hold cleanup
- Glossary — Vacant Unit Preference — Include manual blocks before blaming holds
- Managing a Check-in — Occupancy KPI to block hygiene handoff — Timeline overlap from stale holds on Step 1
- Managing a Check-out — Occupancy KPI to block hygiene handoff — Calendar bars persist after Step 7
- Cancelling a Booking — Occupancy KPI to block hygiene handoff — Availability not restored on Step 5
- Entering Monthly Utility Bills — Occupancy KPI to block hygiene handoff — Dashboard vs Analytics vacancy mismatch on Step 5
- Notification triage — Occupancy KPI to block hygiene handoff — Vacant Units vs Analytics on Step 1
- Resetting a Management User Password — Occupancy KPI to block hygiene handoff — Lockout-delayed KPI review after Step 3
- Using in-app support — Occupancy KPI to block hygiene handoff — Calendar edit blocked after block hygiene
- Handling a Late Payment — Occupancy KPI to block hygiene handoff — Vacant Units vs Multicalendar holds on Step 1
- FAQ — Occupancy KPI to block hygiene handoff hub — Symptom table for Vacant Units vs Analytics mismatch
Partly collected security deposit
Deposit shortfalls pair with Finance — Deposits status summary cards and Bookings — Deposit tab. Hub parity: Common Workflows — Partly collected security deposit. Full pairing matrix: Dashboard section cross-reference · Module cross-reference.
- Common Workflows — Partly collected security deposit — Hub matrix when Paid on the deposit is above zero but below Amount
- Finance — Deposit lifecycle status cards — Partial paid card for portfolio triage (#2091)
- Finance — Deposit status filter — Other filters → Deposit status → Partial paid on Bookings and Finance (#2090)
- Operations — Tickets toolbar search — Paste the full sequential ticket ID (for example
S259,T27) in toolbar Search (#2074) - FAQ — Find a ticket by its ID — Paste the full sequential ticket ID (for example
S259,T27) in Operations → Tickets toolbar Search (#2074) - FAQ — Skip automatic check-in/out tickets for one booking — Turn off Use unit contract rents and other contract details on Add booking to reveal CI/CO ticket checkboxes (#1140)
- FAQ — Same-day turnovers — Check-out + check-in on one unit same day: Operations → Check-in & Check-out, Timeline / Multicalendar, turnover tickets
- FAQ — Manual payments after Delete Booking — Delete Booking hides manual/provider_platform rows on Finance → Transactions; vIBAN and credit card stay visible (#1897)
- FAQ — Communication or Tickets load failure — Tab-scoped Refresh (Communication) or Retry (Tickets); other booking sidebar tabs stay usable
- Glossary — Directory list load failures — First-fetch directory failures show Retry / Try again; distinct from filter-empty states and booking-sidebar tab errors
- Bookings — Deposit tab — Partially paid badge and remaining helper on a single reservation
- FAQ — Partly collected security deposit — Distinct from Partial Paid rent on Payment Plan
- Portfolio KPI review — Step 7 — Include deposit shortfalls during month-end sign-off
- Finance — Deposit lifecycle status cards — Deposit lifecycle status row (#2091)
- Glossary — Deposit lifecycle status —
depositStatuspill vocabulary (Partial Paid vs rent Partial Paid) - Finance — Deposit lifecycle status cards — Deposit lifecycle status row on Finance → Deposits; click Partial paid for collection shortfalls (#2091)
- Manual block hygiene — Partly collected security deposit — Partial paid card when debt KPIs stay high after holds cleared (Step 5)
- Resetting a Management User Password — Partly collected security deposit — Lockout-delayed deposit triage after Step 3
- Using in-app support — Partly collected security deposit — File Finance module tickets when partial filter or badge behaviour is wrong
- Entering Monthly Utility Bills — Directory list load failures — Utilities tab Retry on bill entry (Step 2)
- Handling a Late Payment — Directory list load failures — Receivables directory Retry on collections triage (Step 1)
- Managing a Check-in — Directory list load failures — Check-in & Check-out Retry on arrival-week planning (Step 1)
- Notification triage — Directory list load failures — /notifications Try again before alert row-click (Step 2)
- Resetting a Management User Password — Directory list load failures — Directory Retry after lockout catch-up (Step 3)
- Using in-app support — Directory list load failures — Support inbox Retry before filing tickets
Month-end invoicing (fixed date)
Post-login Total Debt month-end sign-off pairs with saving fixed Invoice date before Finance → Transactions bulk Issue allocation — contrast Portfolio KPI review — Step 7. Hub parity: Common Workflows — Month-end invoicing (fixed date). Full pairing matrix: Dashboard section cross-reference · Module cross-reference.
- Common Workflows — Month-end invoicing (fixed date) — Hub matrix (
settings-invoicing-invoice-date-toggle.png,finance-transactions-fixed-invoice-date-banner.png,finance-transactions-bulk-toolbar-fixed-invoice-date-banner.png) - Invoicing — Default invoice date — Account-wide toggle + Save
- Common Workflows — Bulk Hostkit invoicing — Issue allocation after fixed date is saved
- KPI cards (top-left grid) — Total debt after month-end batch
- Finance — Month-end invoicing with a fixed date — Six-step habit from Transactions
- Processing a New Booking — Month-end invoicing (fixed date) — First-month bulk export after confirmation (Step 6b)
- Handling a Late Payment — Month-end invoicing (fixed date) — Collections batch during Step 6b
- Portfolio KPI review — Month-end invoicing (fixed date) — Step 7 sign-off mesh
- Notification triage — Month-end invoicing (fixed date) — Alert cleanup before bulk Issue allocation (Step 5)
- Entering Monthly Utility Bills — Month-end invoicing (fixed date) — Finish Missing data + overage Pending (Steps 4b–5)
- Manual block hygiene — Month-end invoicing (fixed date) — Clear stale holds before Issue allocation (Step 5)
- Using in-app support — Month-end invoicing (fixed date) — Self-serve before filing wrong-date tickets
- Resetting a Management User Password — Month-end invoicing (fixed date) — Lockout-delayed month-end export after Step 3
- FAQ — Month-end invoicing (fixed date) hub — Post-login Total Debt month-end sign-off needing fixed Invoice date symptom table
Bulk Hostkit invoicing
Post-login Total Debt may lag until Finance → Transactions bulk Issue allocation completes — pair Month-end invoicing (fixed date) when the amber fixed-date banner precedes the batch. Hub parity: Common Workflows — Bulk Hostkit invoicing. Full pairing matrix: Dashboard section cross-reference · Module cross-reference.
- Common Workflows — Bulk Hostkit invoicing — Hub matrix (
finance-transactions-bulk-selection-bar.png,settings-invoicing-hostkit-series.png) - Common Workflows — Month-end invoicing (fixed date) — Fixed Invoice date before bulk Issue allocation
- Settings > Invoicing — Hostkit invoice series — Required FR code before Issue allocation
- Finance — Invoice automation — Bulk Issue allocation / Invoice selected toolbar
- Finance — Issuing credit notes (integrated invoicing) — Issue credit notes (N) after invoiced Reject / Revert
- KPI cards (top-left grid) — Total debt after bulk Issue allocation
- Finance — Bulk Hostkit invoicing — Transactions toolbar reference
- Processing a New Booking — Bulk Hostkit invoicing — First-month Issue allocation after confirmation (Step 6b)
- Handling a Late Payment — Bulk Hostkit invoicing — Collections month-end mesh (Step 6b)
- Portfolio KPI review — Bulk Hostkit invoicing — Step 7 month-end sign-off
- Managing a Check-in — Bulk Hostkit invoicing — Move-in Pending mesh (Step 6b)
- Managing a Check-out — Bulk Hostkit invoicing — Departure-week mesh (Step 6b)
- Onboarding a New Property — Bulk Hostkit invoicing — First month-end on new inventory
- Cancelling a Booking — Bulk Hostkit invoicing — Settlement bulk export (Step 6b)
- Notification triage — Bulk Hostkit invoicing — Alert cleanup before bulk export (Step 5)
- Entering Monthly Utility Bills — Bulk Hostkit invoicing — Finish Missing data + overage Pending (Steps 4b–5)
- Manual block hygiene — Bulk Hostkit invoicing — Clear stale holds before Issue allocation (Step 5)
- Using in-app support — Bulk Hostkit invoicing — Self-serve Hostkit pacing before filing tickets
- Resetting a Management User Password — Bulk Hostkit invoicing — Lockout-delayed month-end export after Step 3
- FAQ — Bulk Hostkit invoicing slow — Hostkit HTTP 429 pacing and refresh-before-reissue habit
- FAQ — Bulk Hostkit invoicing hub — Post-login Total Debt lagging until bulk Issue allocation completes symptom table
Directory list load failures
Post-login / may show Some dashboard data failed to load. + Retry under the page header while other KPI widgets still render from cache — pair Partial data load failures with whole-module Bookings / Sales list-card Retry during month-end reconciliation. Hub parity: Common Workflows — Directory list load failures. Full pairing matrix: Dashboard section cross-reference · Module cross-reference.
- Common Workflows — Directory list load failures — Hub matrix (
dashboard-partial-data-load-failure.png,notifications-module-load-failure.png) - Partial data load failures — / aggregate banner Retry
- Manual block hygiene — Directory list load failures — Sales / Dashboard Retry on Step 5 reconcile
- Handling a Late Payment — Directory list load failures — Total Debt headline vs failed aggregate
- Portfolio KPI review — Directory list load failures — Month-end sign-off after Retry (Step 7)
- FAQ — Directory list load failures — Symptom table and module surfaces
- FAQ — Directory list load failures hub — Post-login
/aggregate banner Retry vs partial widget render symptom table - Glossary — Directory list load failures hub — Surface table + per-guide/module mesh reciprocal hub
Portfolio segmentation by tenant category
Segment filters pair with Settings > Tenant categories and Portfolio KPI review — Step 6. Hub parity: Common Workflows — Portfolio segmentation by tenant category. Full pairing matrix: Dashboard section cross-reference · Module cross-reference.
- Common Workflows — Portfolio segmentation by tenant category — Hub matrix when KPI review needs one tenant segment before account-wide decisions
- Finance — Tenant category filter — Scope Overview debt drill-down by segment during daily triage
- Bookings — Other filters — Tenant category on reservation counts that feed occupancy KPIs
- Analytics module — Month-range charts when Dashboard snapshot suggests one segment underperforms
- Portfolio KPI review — Step 6 — Optional segment pass after Dashboard flags weak headline KPIs
Key glossary terms
Glossary rows pair with Glossary cluster cross-reference. Full pairing matrix: Dashboard section cross-reference · Module cross-reference.
-
Credit note (payment reject/revert) — When Total Debt KPI follow-up finds duplicate or already-invoiced receipts on Transactions
-
Deposit dispute — When Total Debt or check-out follow-up finds contested deposit retention before refund
-
Glossary — End-of-Booking cost split — Charge Time → End of Booking splits daily overage across every occupied unit; still-staying roommates stay in the denominator (#2111)
-
Operations — Property-level ticket search — Property-name matches share the top relevance tier with unit hits; building-scoped rows float first under an active Property filter (#2089)
-
Glossary — Change history — Operator-initiated edits on Listings setup and Bookings Changelog; create-time defaults excluded (#2093)
-
FAQ — Booking Changelog scope — Operator-initiated edits only; create-time defaults excluded (#2093)
-
Glossary — Archived booking ledger visibility — Delete Booking hides manual/provider_platform rows on Finance → Transactions; vIBAN and credit card stay visible (#1897)
-
Bookings — Provider platform payment — Non-rejected provider platform in-payment blocks Delete Booking until Reject or assign (#2076)
-
FAQ — Delete Booking on integration reservation — Clear pending provider platform in-payment with Reject or assign before soft-archive (#2076)
-
Listings — Property edit sidebar pills — Setup / Full integration / Photos pills on property and unit edit sidebars; replaced the old Go to details shortcut (#2082)
-
Glossary — Finance tenant category cache refresh — Recategorizing a tenant on Tenants → Tenant Info force-refreshes Finance caches so Contract Values, Overview, and Deposits filters match within seconds (#2088)
-
FAQ — Finance tenant category filter parity — Finance Other filters drawer lists segments on cached bookings only; mirror Bookings / Tenants when a segment is missing
-
FAQ — Assign tenant category for direct booking — Add booking has no category field; assign on Tenants → Tenant Info or + Create New → Tenant before contract mail
-
Glossary — SIMAR water contract ID — SIMAR (Loures e Odivelas) water bills use Cód. Local in Connections — not Nº de Contador; leading zeros stripped (#2110)
-
FAQ — SIMAR water bill property match — Cód. Local in Connections — not Nº de Contador; strip leading zeros (#2110)
-
Glossary — Per-booking maintenance ticket opt-out — Add booking checkboxes skip automatic CI/CO tickets for one reservation only; property rule unchanged (#1140)
-
FAQ — Cancel Booking vs Delete Booking — Cancel for real stays with settlement; Delete soft-archives mistaken/test rows (#1897 / #2076)
-
Glossary — Archived property — Archive retires a building to Listings → Archived without deleting bookings; distinct from Delete Booking (reservation soft-archive) — Listings — Archived properties
-
FAQ — Archive a property — Edit property sidebar Archive / Unarchive on Listings; building-level — not Delete Booking or Cancel booking
-
FAQ — Portfolio retirement decisions — Archive property (building) vs Cancel booking vs Delete Booking (reservation soft-archive) — three-way decision table
-
Deposit lifecycle status —
depositStatuspill vocabulary when KPI follow-up surfaces deposit shortfalls -
Finance — Deposit status filter — Other filters → Deposit status multi-select on Bookings and Finance (#2090)
-
Invoiced floor (rent) — Rent relief blocked below exported invoice totals during KPI-driven rate reviews
-
FAQ — Bulk Hostkit invoicing slow — Vivin paces Hostkit API calls and retries HTTP 429 during bulk Issue allocation / Invoice selected; refresh Transactions before re-issuing
-
Tenant category — Bookings, Finance, and Tenants segmentation when KPI follow-up clusters on one cohort
-
FAQ — AI token usage — Poll GET /ai-usage / GET /ai-usage/summary with management JWT;
landlord_chat+utility_bill_extraction; no management UI screen yet -
FAQ — Automatic check-in email — Trigger matrix, 15-day cutoff, paper upload vs portal signing, Nuki-only toggle, Send / Resend on Contract Info
-
FAQ — WhatsApp and email per booking — Bookings → Communication tab when tenant chatbot is enabled; Inbox for portfolio-wide triage
-
FAQ — Deposit missing on Finance Deposits — Default ~3 months date range; clear or widen before triaging older move-outs or dispute row actions
-
FAQ — Pending manual in-payment on /notifications — Alert persists until Approve payments clears Finance or booking Transactions
-
FAQ — Uncovered Debt KPI — Finance Total Debt minus deposit offsets; pair with Debt Aging and In debt drill-down
-
FAQ — Lower rent below invoiced — Change monthly rent clamps and Contract Values → Edit amount blocks net below exported invoice totals; use credit notes in accounting when you truly need a reduction
-
FAQ — Reject or revert an incoming payment — Reject pending rows or Revert confirmed ones; Finance → Transactions uses Reject selected bulk-only; modals warn about credit notes when Finance already invoiced
-
FAQ — Finance Income status drill-down hub — Symptom table for segment vs Debt Aging
-
FAQ — Finance Income status drill-down — Overview Income chart (Paid / Scheduled / In debt); click a segment for month-scoped payment-line modal; Debt Aging for booking-level receivables
-
FAQ — Cash flow forecast drill-down hub — Symptom table for collections vs Income / Dashboard
-
FAQ — Cash flow forecast drill-down — Month / Day bar-click habit on Cash flow forecast
-
FAQ — Bookings that owe money — Top debtors and overdue buckets when the Total Debt card is not a table
-
FAQ — Phone shows Operations only — Mobile phone user agent locks operators with Operations access to
/operations; iPads and narrow desktop browsers keep the full module list -
FAQ — Notification row-click navigation — On
/notifications, row click marks unread then openslink,bookingId,tenantId,listingId, orpropertyId(first match); Dashboard bell General rows stay in-panel unlesslinkis set -
FAQ — Bookings that owe money — Top debtors and overdue buckets on Finance → Overview; Total Debt KPI is not a table
-
FAQ — Fixed rent on variable unit — Variable listing + equal rent every contract month → booking stores fixed headline Monthly rent; payment plan unchanged
API & companion guides
API bullets pair with API Reference hub. Full pairing matrix: Dashboard section cross-reference · Module cross-reference.
- API Reference — Listings & Availability — Partner partial pulls whose
unavailabilitiesshould reconcile with Vacant Units and Occupancy Forecast here - API Reference hub — Partner HTTP contracts and partial vs full feeds
Module documentation hubs
Module hub bullets pair with Modules — Module cross-reference. Full pairing matrix: Dashboard section cross-reference · Module cross-reference.
- Dashboard module — Hub for post-login KPI snapshot, Occupancy/Cash Flow forecasts, Vacant Units, and bell notification triage (this page)
- Analytics module — Month-range portfolio KPI charts (Overview, Revenue, Occupancy, ADR, RevPAR, Maintenance) with rankings and heatmaps (hub)
- Listings module — Property wizard, Channels tab, Archived inventory, and unit management (hub)
- Finance module — Portfolio ledgers (Overview, Income, Contract Values, Transactions, Payouts, Deposits) with payment approval and deposit settlement (hub)
- Tenants module — Tenant directory, profile sidebars, With Debt segmentation, and table expand for linked bookings (hub)
- Sales module — Portfolio availability, monthly rent editing, and channel manager connections (hub)
- Operations module — Maintenance tickets, cash flows, check-in/out coordination, Draft ticket queues, and linked cash flows (hub)
- Utilities module — Bills Included ceiling model, Connections, AI bill upload, and tenant overage charges on payment plans (hub)
- Inbox module — Portfolio-wide WhatsApp workspace with Dashboard bell Inbox sub-tab deep links (hub)
- Notifications module — Full
/notificationshistory with search, filters, and row-click navigation (hub) - AI Chat module — Vivin-internal AI Assistant using Landlord MCP tools for portfolio Q&A (hub)
- Audit module — Portfolio-wide Manual Blocks and Discounts contract-value review (hub)
- Properties workspace — Legacy
/propertiesURL redirects into Listings (hub) - Booking engine details — Rich marketplace payload editor via the Full integration pill (hub)
- Account Settings — Workspace-wide financial policies, templates, integrations, and operational defaults (hub)
- API Reference hub — Partner HTTP contracts, Swagger onboarding, and partial vs full feeds (hub)